Opencv图像处理系列 ——2.图像的阈值分割处理
图像的阈值处理
- 1.图像阈值分割二值化
- 2.图像自适应阈值
- 3.Otsu二值化(大津阈值分割法)
本节我们将介绍如实使用OpenCV进行图像的一些简单处理,主要介绍图像的二值化等。
1.图像阈值分割二值化
OpenCV提供对于灰度图像(单通道图像)的简单二值分割函数cv2.threshold()。其用法如下:
ret, dst= cv2.threshold (src, thresh, maxval, type)
| 参数 | 说明 |
|---|---|
| src | 输入图像,只能是单通道图像,通常为灰度图像 |
| dst | 输出图像 |
| thresh | 阈值,取值范围0~255 |
| maxval | 当像素值超过了阈值(或者小于阈值,根据type决定),所赋予的值 |
| type | 阈值类型,共五种,具体见下表 |
| type | 释义 |
|---|---|
| cv2.THRESH_BINARY | 二进制阈值化,超过阈值部分取maxval,否则取0 |
| cv2.THRESH_BINARY_INV | 反二进制阈值化,超过阈值部分取0,否则取maxval |
| cv2.THRESH_TRUNC | 截断阈值化 ,大于阈值设为阈值,否则不变 |
| cv2.THRESH_TOZERO | 大于阈值部分不变,小于阈值为0 |
| cv2.THRESH_TOZERO_INV | 大于阈值部分取0,小于阈值不变 |
import cv2
import numpy as np
from matplotlib import pyplot as plt

#必须为灰度图,单通道,如果是彩色图像则需转化
img = cv2.imread(r'C:\Users\..\Pictures\Saved Pictures\Jordan.jpg')
gray = cv2.cvtColor(img, cv2.COLOR_BGR2GRAY)
ret, thresh1 = cv2.threshold(gray, 127, 255, cv2.THRESH_BINARY)
ret, thresh2 = cv2.threshold(gray, 127, 255, cv2.THRESH_BINARY_INV)
ret, thresh3 = cv2.threshold(gray, 127, 255, cv2.THRESH_TRUNC)
ret, thresh4 = cv2.threshold(gray, 127, 255, cv2.THRESH_TOZERO)
ret, thresh5 = cv2.threshold(gray, 127, 255, cv2.THRESH_TOZERO_INV)
titles = ['Original Image','BINARY','BINARY_INV','TRUNC','TOZERO','TOZERO_INV']
images = [img, thresh1, thresh2, thresh3, thresh4, thresh5]
for i in range(6):
    plt.subplot(2,3,i+1),plt.imshow(images[i],'gray')
    plt.title(titles[i])
    #不显示坐标轴
    plt.xticks([]),plt.yticks([])
plt.show()
2.图像自适应阈值
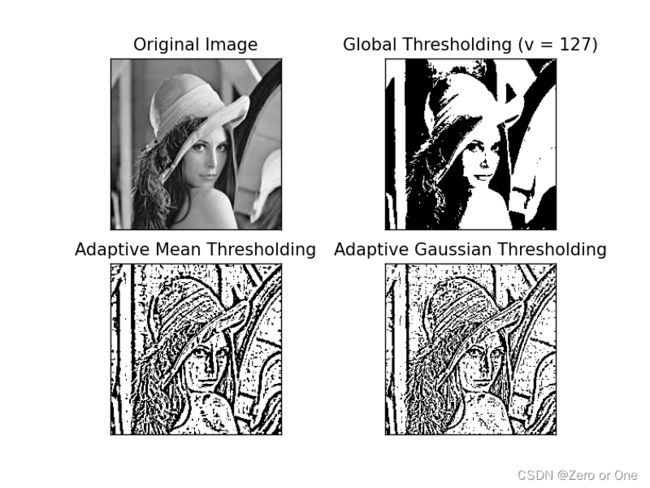
图像自适应阈值(adaptiveThreshold()),用于二值化处理图像,对于对比大的图像有较好效果,相对于固定阈值化操作(threshold()),自适应阈值中图像中每一个像素点的阈值是不同的,自适应阈值二值化函数根据图片一小块区域的值来计算对应区域的阈值,从而得到也许更为合适的图片,该阈值由其邻域中图像像素带点加权平均决定。这样做有以下好处:
- 每个像素位置处的二值化阈值不是固定不变的,而是由其周围邻域像素的分布来决定的。
- 亮度较高的图像区域的二值化阈值通常会较高,而亮度较低的图像区域的二值化阈值则会相适应地变小。
- 不同亮度、对比度、纹理的局部图像区域将会拥有相对应的局部二值化阈值。
dst = cv2.adaptiveThreshold(src, maxval, thresh_type, type, Block Size, C)
| 参数 | 说明 |
|---|---|
| src | 输入图像,只能是单通道图像,通常为灰度图像 |
| dst | 输出图像 |
| maxval | 填充色,取值范围0~255 |
| thresh_type | 阈值的计算方法,共两种,见下表 |
| type | 阈值类型,只有两个取值,分别为 THRESH_BINARY 和THRESH_BINARY_INV |
| Block Size | 每个像素用于计算阈值的邻域块大小,这是局部邻域大小,3、5、7等 |
| C | 阈值计算中的常数偏移值调整量,用均值和高斯计算阈值后,再减或加这个值就是最终阈值 |
| type | 释义 |
|---|---|
| cv2.ADAPTIVE_THRESH_MEAN_C | 通过计算邻域的均值获取阈值 |
| cv2.ADAPTIVE_THRESH_GAUSSIAN_C | 通过计算邻域的高斯均值获取阈值 |
import cv2
import numpy as np
from matplotlib import pyplot as plt
img = cv2.imread(r'C:\Users\..\Pictures\Saved Pictures\lena.jpg')
gray = cv2.cvtColor(img, cv2.COLOR_BGR2GRAY)
ret, th1 = cv2.threshold(gray, 127, 255, cv2.THRESH_BINARY)
# 7为 Block size, 2 为 C 值
th2 = cv2.adaptiveThreshold(gray, 255, cv2.ADAPTIVE_THRESH_MEAN_C, \
                            cv2.THRESH_BINARY, 7, 2)
th3 = cv2.adaptiveThreshold(gray, 255, cv2.ADAPTIVE_THRESH_GAUSSIAN_C, \
                            cv2.THRESH_BINARY, 7, 2)
titles = ['Original Image', 'Global Thresholding (v = 127)',
          'Adaptive Mean Thresholding', 'Adaptive Gaussian Thresholding']
images = [gray, th1, th2, th3]
for i in range(4):
    plt.subplot(2, 2, i + 1), plt.imshow(images[i], 'gray')
    plt.title(titles[i])
    plt.xticks([]), plt.yticks([])
plt.show()
结果为:

自适应阈值相比于固定阈值处理图像的时候,能提供更多的信息,固定阈值在整体灰度低的区域没有任何细节信息,而自适应阈值却通过合理的淋浴信息提取,保留了信息,其在处理和提取图像信息时具有更好的效果。
3.Otsu二值化(大津阈值分割法)
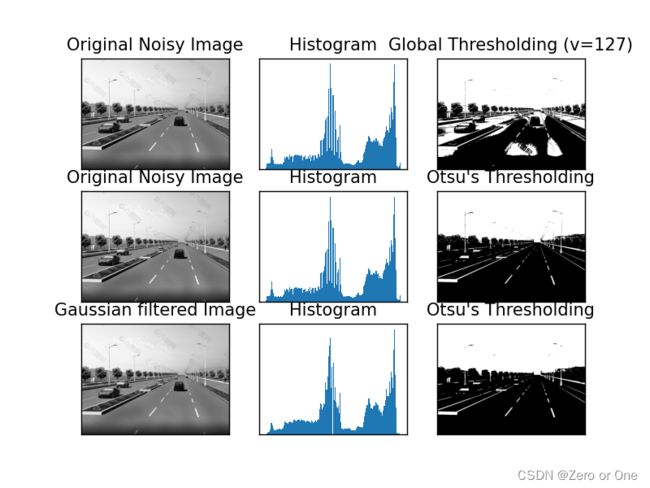
OTSU二值化俗称大津法,主要用于图像的阈值分割,主要是针对双峰影像(指的是图像的直方图为双峰影像)。从大津法的原理上来讲,该方法又称作最大类间方差法,因为按照大津法求得的阈值进行图像二值化分割后,前景与背景图像的类间方差最大。是求图像全局阈值的最佳方法。
优点:计算简单快速,不受图像亮度和对比度的影响。
缺点:对图像噪声敏感;只能针对单一目标分割;当目标和背景大小比例悬殊、类间方差函数可能呈现双峰或者多峰,这个时候效果不好。
import cv2
import numpy as np
from matplotlib import pyplot as plt

img = cv2.imread(r'C:\Users\..\Pictures\Saved Pictures\road4.jpg')
img = cv2.cvtColor(img, cv2.COLOR_BGR2GRAY)
# 全局阈值
ret1, th1 = cv2.threshold(img, 127, 255, cv2.THRESH_BINARY)
# Otsu's thresholding
ret2, th2 = cv2.threshold(img, 0, 255, cv2.THRESH_BINARY + cv2.THRESH_OTSU)
# Otsu's thresholding after Gaussian filtering
# (5,5)为高斯核的大小, 0 为标准差
blur = cv2.GaussianBlur(img, (5, 5), 0)
# 阈值一定要设为 0!
ret3, th3 = cv2.threshold(blur, 0, 255, cv2.THRESH_BINARY + cv2.THRESH_OTSU)
# plot all the images and their histograms
images = [img, 0, th1,
          img, 0, th2,
          blur, 0, th3]
titles = ['Original Noisy Image', 'Histogram', 'Global Thresholding (v=127)',
          'Original Noisy Image', 'Histogram', "Otsu's Thresholding",
          'Gaussian filtered Image', 'Histogram', "Otsu's Thresholding"]
# 这里使用了 pyplot 中画直方图的方法, plt.hist, 要注意的是它的参数是一维数组
# 所以这里使用了(numpy)ravel 方法,将多维数组转换成一维,也可以使用 flatten 方法
# ndarray.flat 1-D iterator over an array.
# ndarray.flatten 1-D array copy of the elements of an array in row-major order.
for i in range(3):
    plt.subplot(3, 3, i * 3 + 1), plt.imshow(images[i * 3], 'gray')
    plt.title(titles[i * 3]), plt.xticks([]), plt.yticks([])
    plt.subplot(3, 3, i * 3 + 2), plt.hist(images[i * 3].ravel(), 256)
    plt.title(titles[i * 3 + 1]), plt.xticks([]), plt.yticks([])
    plt.subplot(3, 3, i * 3 + 3), plt.imshow(images[i * 3 + 2], 'gray')
    plt.title(titles[i * 3 + 2]), plt.xticks([]), plt.yticks([])
plt.show()

