随机森林超参数的网格优化(机器学习的精华--调参)
随机森林超参数的网格优化(机器学习的精华–调参)
随机森林各个参数对算法的影响
| 影响力 | 参数 |
|---|---|
| ⭐⭐⭐⭐⭐ 几乎总是具有巨大影响力 |
n_estimators(整体学习能力) max_depth(粗剪枝) max_features(随机性) |
| ⭐⭐⭐⭐ 大部分时候具有影响力 |
max_samples(随机性) class_weight(样本均衡) |
| ⭐⭐ 可能有大影响力 大部分时候影响力不明显 |
min_samples_split(精剪枝) min_impurity_decrease(精剪枝) max_leaf_nodes(精剪枝) criterion(分枝敏感度) |
| ⭐ 当数据量足够大时,几乎无影响 |
random_state ccp_alpha(结构风险) |
探索的第一步(学习曲线)
先看看n_estimators的学习曲线(当然我们也可以看一下其他参数的学习曲线)
#参数潜在取值,由于现在我们只调整一个参数,因此参数的范围可以取大一些、取值也可以更密集
Option = [1,*range(5,101,5)]

#生成保存模型结果的arrays
trainRMSE = np.array([])
testRMSE = np.array([])
trainSTD = np.array([])
testSTD = np.array([])

#在参数取值中进行循环
for n_estimators in Option:

    #按照当下的参数,实例化模型
    reg_f = RFR(n_estimators=n_estimators,random_state=83)

    #实例化交叉验证方式,输出交叉验证结果
    cv = KFold(n_splits=5,shuffle=True,random_state=83)
    result_f = cross_validate(reg_f,X,y,cv=cv,scoring="neg_mean_squared_error"
                              ,return_train_score=True
                              ,n_jobs=-1)

    #根据输出的MSE进行RMSE计算
    train = abs(result_f["train_score"])**0.5
    test = abs(result_f["test_score"])**0.5

    #将本次交叉验证中RMSE的均值、标准差添加到arrays中进行保存
    trainRMSE = np.append(trainRMSE,train.mean()) #效果越好
    testRMSE = np.append(testRMSE,test.mean())
    trainSTD = np.append(trainSTD,train.std()) #模型越稳定
    testSTD = np.append(testSTD,test.std())
定义画图函数
def plotCVresult(Option,trainRMSE,testRMSE,trainSTD,testSTD):
    #一次交叉验证下,RMSE的均值与std的绘图
    xaxis = Option
    plt.figure(figsize=(8,6),dpi=80)

    #RMSE
    plt.plot(xaxis,trainRMSE,color="k",label = "RandomForestTrain")
    plt.plot(xaxis,testRMSE,color="red",label = "RandomForestTest")

    #标准差 - 围绕在RMSE旁形成一个区间
    plt.plot(xaxis,trainRMSE+trainSTD,color="k",linestyle="dotted")
    plt.plot(xaxis,trainRMSE-trainSTD,color="k",linestyle="dotted")
    plt.plot(xaxis,testRMSE+testSTD,color="red",linestyle="dotted")
    plt.plot(xaxis,testRMSE-testSTD,color="red",linestyle="dotted")
    plt.xticks([*xaxis])
    plt.legend(loc=1)
    plt.show()

plotCVresult(Option,trainRMSE,testRMSE,trainSTD,testSTD)
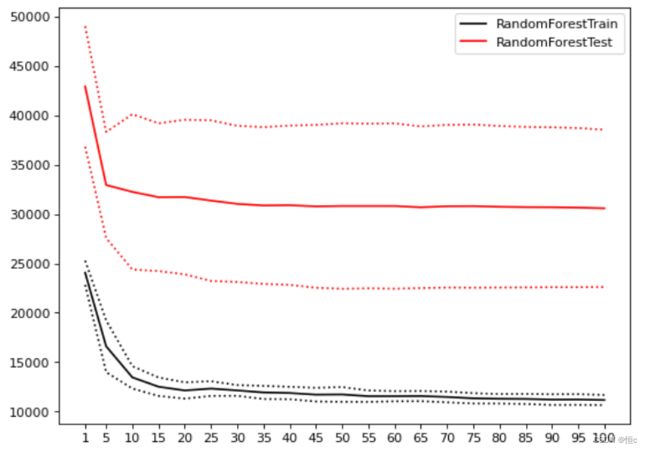
当绘制学习曲线时,我们可以很容易找到泛化误差开始上升、或转变为平稳趋势的转折点。因此我们可以选择转折点或转折点附近的n_estimators取值,例如20。然而,n_estimators会受到其他参数的影响,例如:
- 单棵决策树的结构更简单时(依赖剪枝时),可能需要更多的树
- 单棵决策树训练的数据更简单时(依赖随机性时),可能需要更多的树
因此n_estimators的参数空间可以被确定为range(20,100,5),如果你比较保守,甚至可以确认为是range(15,25,5)。
探索第二步(随机森林中的每一棵决策树)
属性
.estimators_,查看森林中所有的树
| 参数 | 参数含义 | 对应属性 | 属性含义 |
|---|---|---|---|
| n_estimators | 树的数量 | reg.estimators_ | 森林中所有树对象 |
| max_depth | 允许的最大深度 | .tree_.max_depth | 0号树实际的深度 |
| max_leaf_nodes | 允许的最大 叶子节点量 |
.tree_.node_count | 0号树实际的总节点量 |
| min_sample_split | 分枝所需最小 样本量 |
.tree_.n_node_samples | 0号树每片叶子上实际的样本量 |
| min_weight_fraction_leaf | 分枝所需最小 样本权重 |
tree_.weighted_n_node_samples | 0号树每片叶子上实际的样本权重 |
| min_impurity_decrease | 分枝所需最小 不纯度下降量 |
.tree_.impurity .tree_.threshold |
0号树每片叶子上的实际不纯度 0号树每个节点分枝后不纯度下降量 |
可以通过对上述属性的调用查看当前模型每一棵树的各个属性,对我们对于参数范围的选择给予帮助。
正戏开始(网格搜索)
import numpy as np
import pandas as pd
import sklearn
import matplotlib as mlp
import matplotlib.pyplot as plt
import time #计时模块time
from sklearn.ensemble import RandomForestRegressor as RFR
from sklearn.model_selection import cross_validate, KFold, GridSearchCV
# 定义RMSE函数
def RMSE(cvresult,key):
    return (abs(cvresult[key])**0.5).mean()
#导入波士顿房价数据
data = pd.read_csv(r"D:\Pythonwork\datasets\House Price\train_encode.csv",index_col=0)
#查看数据
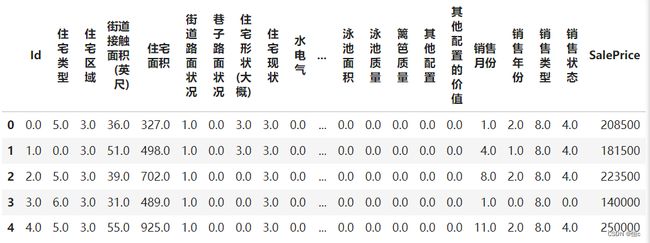
data.head()
X = data.iloc[:,:-1]
y = data.iloc[:,-1]
Step 1.建立benchmark
# 定义回归器
reg = RFR(random_state=83)
# 进行5折交叉验证
cv = KFold(n_splits=5,shuffle=True,random_state=83)

result_pre_adjusted = cross_validate(reg,X,y,cv=cv,scoring="neg_mean_squared_error"
                          ,return_train_score=True
                          ,verbose=True
                          ,n_jobs=-1)
#分别查看训练集和测试集在调参之前的RMSE
RMSE(result_pre_adjusted,"train_score")
RMSE(result_pre_adjusted,"test_score")
结果分别是
11177.272008319653
30571.26665524217
Step 2.创建参数空间
param_grid_simple = {"criterion": ["squared_error","poisson"]
                     , 'n_estimators': [*range(20,100,5)]
                     , 'max_depth': [*range(10,25,2)]
                     , "max_features": ["log2","sqrt",16,32,64,"auto"]
                     , "min_impurity_decrease": [*np.arange(0,5,10)]
                    }
Step 3.实例化用于搜索的评估器、交叉验证评估器与网格搜索评估器
#n_jobs=4/8,verbose=True
reg = RFR(random_state=1412,verbose=True,n_jobs=-1)
cv = KFold(n_splits=5,shuffle=True,random_state=83)
search = GridSearchCV(estimator=reg
                     ,param_grid=param_grid_simple
                     ,scoring = "neg_mean_squared_error"
                     ,verbose = True
                     ,cv = cv
                     ,n_jobs=-1)
Step 4.训练网格搜索评估器
#=====【TIME WARNING: 15mins】=====#   当然博主的电脑比较慢
start = time.time()
search.fit(X,y)
print(time.time() - start)
Step 5.查看结果
search.best_estimator_

# 直接使用最优参数进行建模
ad_reg = RFR(n_estimators=85, max_depth=23, max_features=16, random_state=83)

cv = KFold(n_splits=5,shuffle=True,random_state=83)
result_post_adjusted = cross_validate(ad_reg,X,y,cv=cv,scoring="neg_mean_squared_error"
                          ,return_train_score=True
                          ,verbose=True
                          ,n_jobs=-1)
#查看调参后的结果
RMSE(result_post_adjusted,"train_score")
RMSE(result_post_adjusted,"test_score")
得出结果
11000.81099038192
28572.070208366855
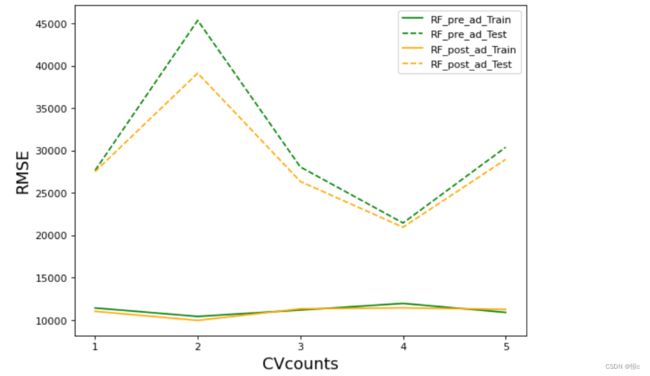
调参前后对比
#默认值下随机森林的RMSE
xaxis = range(1,6)
plt.figure(figsize=(8,6),dpi=80)
#RMSE
plt.plot(xaxis,abs(result_pre_adjusted["train_score"])**0.5,color="green",label = "RF_pre_ad_Train")
plt.plot(xaxis,abs(result_pre_adjusted["test_score"])**0.5,color="green",linestyle="--",label = "RF_pre_ad_Test")
plt.plot(xaxis,abs(result_post_adjusted["train_score"])**0.5,color="orange",label = "RF_post_ad_Train")
plt.plot(xaxis,abs(result_post_adjusted["test_score"])**0.5,color="orange",linestyle="--",label = "RF_post_ad_Test")
plt.xticks([1,2,3,4,5])
plt.xlabel("CVcounts",fontsize=16)
plt.ylabel("RMSE",fontsize=16)
plt.legend()
plt.show()

不难发现,网格搜索之后的模型过拟合程度减轻,且在训练集与测试集上的结果都有提高,可以说从根本上提升了模型的基础能力。我们还可以根据网格的结果继续尝试进行其他调整,来进一步降低模型在测试集上的RMSE。

