PyEcharts应用教程及实例
ECharts是一款基于JavaScript的数据可视化图表库,提供直观,生动,可交互,可个性化定制的数据可视化图表。ECharts最初由百度团队开源,并于2018年初捐赠给Apache基金会,成为ASF孵化级项目。
ECharts官网:Apache ECharts
PyEcharts 是一个用于生成 Echarts 图表的类库。 Python 是一门富有表达力的语言,很适合用于数据处理。当数据分析遇上数据可视化时,PyEcharts 诞生了。
目录
一、安装
二、操作
1、折线图(柱状图、散点图适用)
2、饼状图、环状图
3、关系图
4、词云
5、地图
6、雷达图
7、树形图
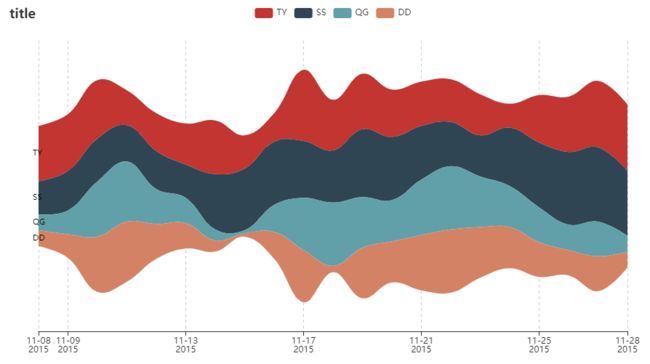
8、 主题河流图
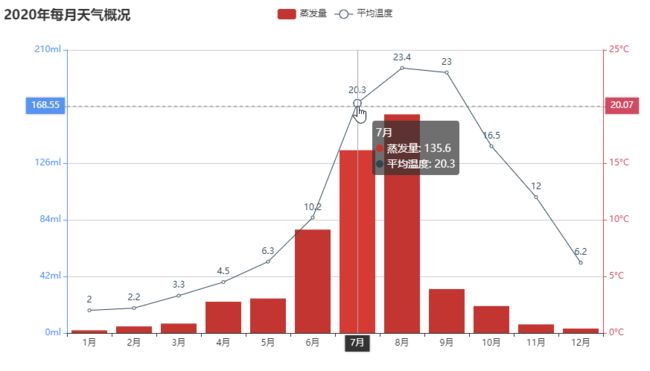
9、 折柱混合图
10、 工具(补充)
一、安装
pip install pyecharts二、操作
from pyecharts import options						# 图形样式编辑
from pyecharts.charts import Graph/Bar/Line/...		# 引入不同图(关系图、柱状图、折线图...)
1、折线图(柱状图、散点图适用)
from pyecharts import options
from pyecharts.charts import Line/Bar/Scatter


def draw(xlist, ylist):
    line = Line()
    line.add_xaxis(xlist)				  # x坐标名称
    line.add_yaxis("线名称", ylist, is_smooth=True)		# 线名称、各点数值、是否平滑
    line.set_global_opts(title_opts=options.TitleOpts(title='name'))	# 表名称
    line.render('xxx.html')			  # 生成html文件


def main():
    xlist = ['一', '二', '三', '四', '五']
    ylist = [3, 9, 15, 21, 27]
    draw(xlist, ylist)


if __name__ == '__main__':
    main()
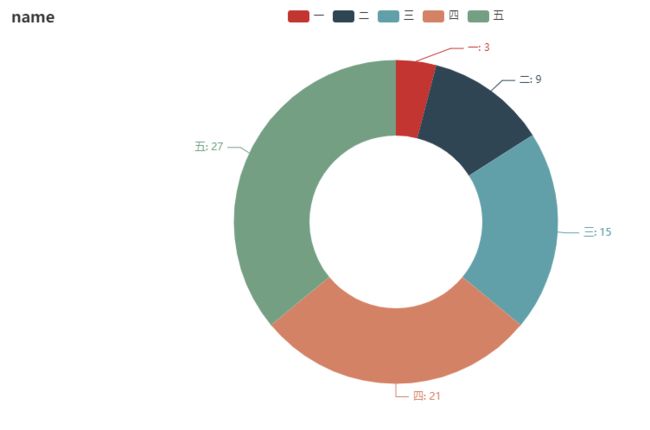
2、饼状图、环状图
from pyecharts import options as opts
from pyecharts.charts import Pie


def draw(blist, nlist):
    pie = Pie()
    # 各部分名称,值;添加radius(内环大小、外环大小)即为环状
    pie.add("", [list(i) for i in zip(nlist, blist)], radius=["40%", "75%"])
    # 表名称
    pie.set_global_opts(title_opts=opts.TitleOpts(title="name"))
    # 显示名称及值
    pie.set_series_opts(label_opts=opts.LabelOpts(formatter="{b}: {c}"))
    # 生成html文件
    pie.render('xxx.html')


def main():
    nlist = ['一', '二', '三', '四', '五']
    blist = [3, 9, 15, 21, 27]
    draw(blist, nlist)


if __name__ == '__main__':
    main()
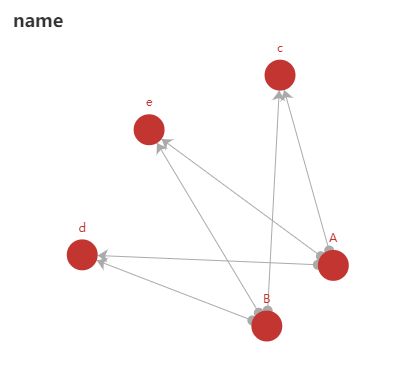
3、关系图
from pyecharts import options as opts
from pyecharts.charts import Graph


def draw(alist, value):
    nodes = []
    for i in range(5):
        nodes.append({'name': alist[i], 'value': value[i]})		# 设置节点名称及对应值(字典格式)

    links = []
    for i in nodes[2:]:
        links.append(opts.GraphLink(source='A', target=i.get('name')))
    for i in nodes[2:]:
        links.append(opts.GraphLink(source='B', target=i.get('name')))	# 连线,指定连线的起始和目标节点

    graph = Graph()
    graph.add("", nodes, links, edge_symbol=['circle', 'arrow'], repulsion=200, is_draggable=True, layout='force')		# repulsion节点间排斥力,is_draggable是否可拖拽节点,layout布局方式(有circular环形布局,force力引导布局,none无)
    graph.set_global_opts(title_opts=opts.TitleOpts(title="name"))	# 表名称
    graph.render('xxx.html')


def main():
    value = [0, 0, 5, 32, 45]
    alist = ['A', 'B', 'c', 'd', 'e']
    draw(alist, value)


if __name__ == '__main__':
    main()
4、词云
from pyecharts.charts import WordCloud

data = [('天气', 23), ('美丽', 10), ('天空', 5) ,('飞鸟', 15) , ('如诗如画', 25) , ('心情', 5), ('哈哈', 17)]

#面向对象方式
cloudObj = WordCloud()

# shap默认为cicrle,其他形状有circle, cardioid, diamond, triangle-forward, triangle, pentagon, star
cloudObj.add('', data, shape='circle')

cloudObj.render('xxx.html')

# shap可更换为图片,但尝试后效果不好。图片存在bug,需刷新网页后才会显示。
# cloudObj.add('', data, mask_image='C:\XXX.png')
5、地图
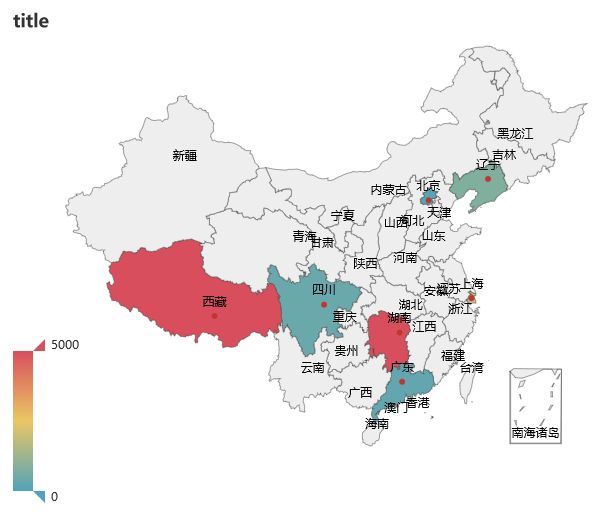
(1)基础地图
from pyecharts.charts import Map
from pyecharts import options as opts


def map(provinces, value):
    map = Map()

    # china可改为world或各省市名称
    map.add("", [list(i) for i in zip(provinces, value)], "china")

    # 表名称;max_为最大值,超过此值都为最大值颜色;split_number,is_piecewise可以将颜色分块显示
    map.set_global_opts(title_opts=opts.TitleOpts(title="title"), visualmap_opts=opts.VisualMapOpts(max_=5000, split_number=8, is_piecewise=True))

    map.render('xxx.html')


def main():
    provinces = ["广东", "北京", "上海", "辽宁", "湖南", "四川", "西藏"]
    value = [300, 100, 2000, 800, 10000, 400, 5000]
    map(provinces, value)


if __name__ == '__main__':
    main()
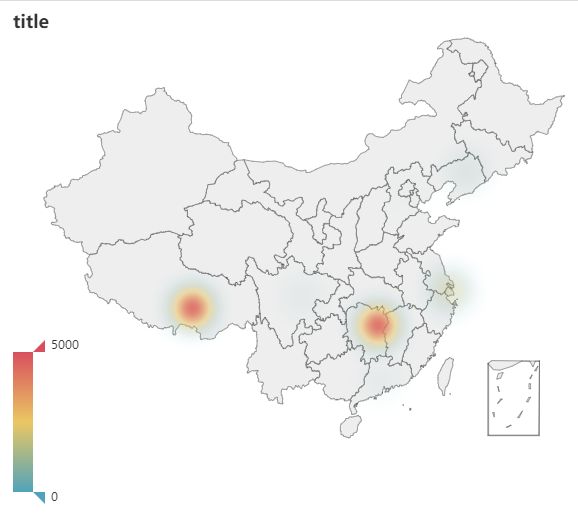
(2)热力地图
from pyecharts.charts import Geo
from pyecharts import options as opts
from pyecharts.globals import ChartType


def map(provinces, value):
    map = Geo()

	# 仅以下两行与基础地图不同
    map.add_schema(maptype="china")
    map.add("", [list(i) for i in zip(provinces, value)], type_=ChartType.HEATMAP)

    map.set_global_opts(title_opts=opts.TitleOpts(title="title"),
                        visualmap_opts=opts.VisualMapOpts(max_=5000))
    map.render('xxx.html')


def main():
    provinces = ["广东", "北京", "上海", "辽宁", "湖南", "四川", "西藏"]
    value = [300, 100, 2000, 800, 10000, 400, 5000]
    map(provinces, value)


if __name__ == '__main__':
    main()
6、雷达图
from pyecharts.charts import Radar
from pyecharts import options as opts


def radar(v1):
    radar = Radar(init_opts=opts.InitOpts())
    radar.add_schema(
        schema=[
            opts.RadarIndicatorItem(name="传球", max_=100),
            opts.RadarIndicatorItem(name="射门", max_=100),
            opts.RadarIndicatorItem(name="身体", max_=100),
            opts.RadarIndicatorItem(name="防守", max_=100),
            opts.RadarIndicatorItem(name="速度", max_=100),
            opts.RadarIndicatorItem(name="盘带", max_=100),
        ],
        splitarea_opt=opts.SplitAreaOpts(is_show=True, areastyle_opts=opts.AreaStyleOpts(opacity=1)),       # 是否显示分隔区域,透明度为1
        textstyle_opts=opts.TextStyleOpts(color="#000000")
    )
    radar.add(series_name="C·罗纳尔多", data=v1, areastyle_opts=opts.AreaStyleOpts(color="#FF0000", opacity=0.2))  # 区域面积,透明度

    radar.set_series_opts(label_opts=opts.LabelOpts(is_show=False))
    radar.set_global_opts(title_opts=opts.TitleOpts(title="标准球员属性雷达图"), legend_opts=opts.LegendOpts(selected_mode="single"))  # 可以设置单一选择查看

    radar.render('xxx.html')


def main():
    v1 = [[83, 92, 87, 49, 89, 86]]
    radar(v1)


if __name__ == '__main__':
    main()
7、树形图
from pyecharts.charts import Tree
from pyecharts import options as opts


def draw(data):
    tree = Tree()
    tree.add('', data)
    tree.set_global_opts(title_opts=opts.TitleOpts(title="title"))
    tree.render('xxx.html')


def main():
    # children数据类型为列表;可以为每个节点写入数值(value)
    data = [
        {"children": [{"name": "B", "value": "1"},
                      {"children": [{"children": [{"name": "I"}], "name": "E"}, {"name": "F"}],
                       "name": "C"},
                      {"children": [{"children": [{"name": "J"}, {"name": "K"}], "name": "G"}, {"name": "H"}],
                       "name": "D"}],
         "name": "A"}
    ]

    draw(data)


if __name__ == '__main__':
    main()
8、 主题河流图
from pyecharts import options as opts
from pyecharts.charts import ThemeRiver


def draw(data, data_list):
    tr = ThemeRiver()

    # series_name各数据名称;data数据数值;SingleAxisOpts河流图位置
    tr.add(series_name=data_list, data=data,
           singleaxis_opts=opts.SingleAxisOpts(pos_top="50", pos_bottom="50", type_="time"))

    # TooltipOpts设置辅助线;LegendOpts设置图例位置
    tr.set_global_opts(title_opts=opts.TitleOpts(title="title"),
                       tooltip_opts=opts.TooltipOpts(trigger="axis", axis_pointer_type="line"),
                       legend_opts=opts.LegendOpts(pos_top=0))
    tr.render('xxx.html')


def main():
    data = [['2015/11/08', 35, 'TY'],
            ['2015/11/09', 36, 'TY'],
            ['2015/11/10', 37, 'TY'],
            ['2015/11/11', 22, 'TY'],
            ['2015/11/12', 24, 'TY'],
            ['2015/11/13', 26, 'TY'],
            ['2015/11/14', 34, 'TY'],
            ['2015/11/15', 21, 'TY'],
            ['2015/11/16', 18, 'TY'],
            ['2015/11/17', 45, 'TY'],
            ['2015/11/18', 32, 'TY'],
            ['2015/11/19', 35, 'TY'],
            ['2015/11/20', 30, 'TY'],
            ['2015/11/21', 28, 'TY'],
            ['2015/11/22', 27, 'TY'],
            ['2015/11/23', 26, 'TY'],
            ['2015/11/24', 15, 'TY'],
            ['2015/11/25', 30, 'TY'],
            ['2015/11/26', 35, 'TY'],
            ['2015/11/27', 42, 'TY'],
            ['2015/11/28', 42, 'TY'],
            ['2015/11/08', 21, 'SS'],
            ['2015/11/09', 25, 'SS'],
            ['2015/11/10', 27, 'SS'],
            ['2015/11/11', 23, 'SS'],
            ['2015/11/12', 24, 'SS'],
            ['2015/11/13', 21, 'SS'],
            ['2015/11/14', 35, 'SS'],
            ['2015/11/15', 39, 'SS'],
            ['2015/11/16', 40, 'SS'],
            ['2015/11/17', 36, 'SS'],
            ['2015/11/18', 33, 'SS'],
            ['2015/11/19', 43, 'SS'],
            ['2015/11/20', 40, 'SS'],
            ['2015/11/21', 34, 'SS'],
            ['2015/11/22', 28, 'SS'],
            ['2015/11/23', 26, 'SS'],
            ['2015/11/24', 37, 'SS'],
            ['2015/11/25', 41, 'SS'],
            ['2015/11/26', 46, 'SS'],
            ['2015/11/27', 47, 'SS'],
            ['2015/11/28', 41, 'SS'],
            ['2015/11/08', 10, 'QG'],
            ['2015/11/09', 15, 'QG'],
            ['2015/11/10', 35, 'QG'],
            ['2015/11/11', 38, 'QG'],
            ['2015/11/12', 22, 'QG'],
            ['2015/11/13', 16, 'QG'],
            ['2015/11/14', 7, 'QG'],
            ['2015/11/15', 2, 'QG'],
            ['2015/11/16', 17, 'QG'],
            ['2015/11/17', 33, 'QG'],
            ['2015/11/18', 40, 'QG'],
            ['2015/11/19', 32, 'QG'],
            ['2015/11/20', 26, 'QG'],
            ['2015/11/21', 35, 'QG'],
            ['2015/11/22', 40, 'QG'],
            ['2015/11/23', 32, 'QG'],
            ['2015/11/24', 26, 'QG'],
            ['2015/11/25', 22, 'QG'],
            ['2015/11/26', 16, 'QG'],
            ['2015/11/27', 22, 'QG'],
            ['2015/11/28', 10, 'QG'],
            ['2015/11/08', 10, 'DD'],
            ['2015/11/09', 15, 'DD'],
            ['2015/11/10', 35, 'DD'],
            ['2015/11/11', 38, 'DD'],
            ['2015/11/12', 22, 'DD'],
            ['2015/11/13', 16, 'DD'],
            ['2015/11/14', 7, 'DD'],
            ['2015/11/15', 2, 'DD'],
            ['2015/11/16', 17, 'DD'],
            ['2015/11/17', 33, 'DD'],
            ['2015/11/18', 4, 'DD'],
            ['2015/11/19', 32, 'DD'],
            ['2015/11/20', 26, 'DD'],
            ['2015/11/21', 35, 'DD'],
            ['2015/11/22', 40, 'DD'],
            ['2015/11/23', 32, 'DD'],
            ['2015/11/24', 26, 'DD'],
            ['2015/11/25', 22, 'DD'],
            ['2015/11/26', 16, 'DD'],
            ['2015/11/27', 22, 'DD'],
            ['2015/11/28', 10, 'DD']]
    data_list = ['TY', 'SS', 'QG', 'DD']
    draw(data, data_list)


if __name__ == '__main__':
    main()
9、 折柱混合图
from pyecharts.charts import Bar, Line
from pyecharts import options as opts

x = ['1月', '2月', '3月', '4月', '5月', '6月', '7月', '8月', '9月', '10月', '11月', '12月']
a = [2.0, 4.9, 7.0, 23.2, 25.6, 76.7, 135.6, 162.2, 32.6, 20.0, 6.4, 3.3]
b = [2.0, 2.2, 3.3, 4.5, 6.3, 10.2, 20.3, 23.4, 23.0, 16.5, 12.0, 6.2]

bar = Bar()
bar.add_xaxis(xaxis_data=x)
bar.add_yaxis(series_name="蒸发量", y_axis=a, label_opts=opts.LabelOpts(is_show=False))

# 增加一个y轴用于折线图的数据展示
# splitline_opts背景辅助线
bar.extend_axis(yaxis=opts.AxisOpts(type_="value", min_=0, max_=25, interval=5,
                                    axislabel_opts=opts.LabelOpts(formatter="{value}°C"),
                                    splitline_opts=opts.SplitLineOpts(is_show=True, linestyle_opts=opts.LineStyleOpts(opacity=1)),
                                    axisline_opts=opts.AxisLineOpts(linestyle_opts=opts.LineStyleOpts(color='#d14a61'))
                                    )
                )

# 左侧y轴及全局设置
bar.set_global_opts(title_opts=opts.TitleOpts(title="2020年每月天气概况"),
                    tooltip_opts=opts.TooltipOpts(is_show=True, trigger="axis", axis_pointer_type="cross"),  # 显示提示框、鼠标辅助线
                    xaxis_opts=opts.AxisOpts(name_location="middle", name_gap=30),
                    yaxis_opts=opts.AxisOpts(type_="value", min_=0, max_=210, interval=42,
                                             axislabel_opts=opts.LabelOpts(formatter="{value}ml"),
                                             axistick_opts=opts.AxisTickOpts(is_show=True),
                                             axisline_opts=opts.AxisLineOpts(linestyle_opts=opts.LineStyleOpts(color='#5793f3'))
                                             )
                    )

# 折线图
line = Line()
line.add_xaxis(xaxis_data=x)

# z大于0可以使折现位于柱状上方
line.add_yaxis(series_name="平均温度", yaxis_index=1, y_axis=b, label_opts=opts.LabelOpts(is_show=True), z=10)

# 将两图写入一个坐标系中
bar.overlap(line)
bar.render('xxx.html')
10、 工具(补充)
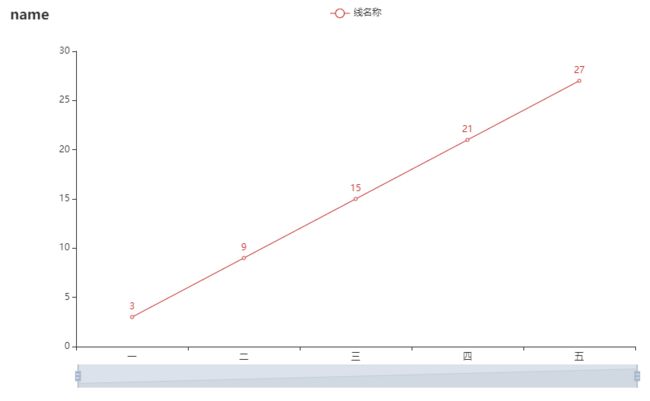
(1)添加区域缩放
'''
以折线图为例
'''
line.set_global_opts(
					 title_opts=opts.TitleOpts(title='name'),
                     datazoom_opts=opts.DataZoomOpts(
                         							 is_show=True
                                                     , range_start=0		# 默认开始位置(最小0)
                                                     , range_end=100		# 默认结束位置(最大100)
                                                     , orient='horizontal'	# 横向horizontal和纵向vertical
                     								)
                    )
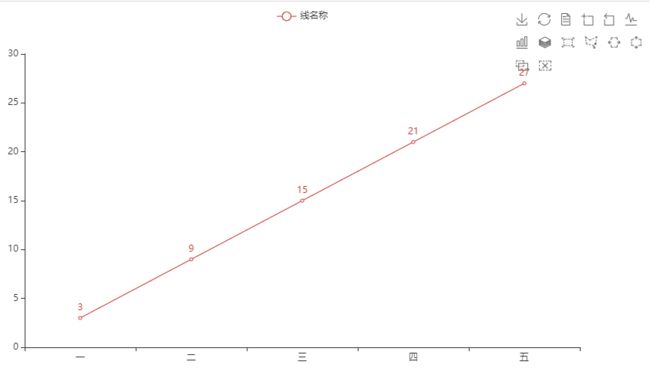
(2)添加工具栏
'''
以折线图为例
'''
line.set_global_opts(toolbox_opts=opts.ToolboxOpts(is_show=True))
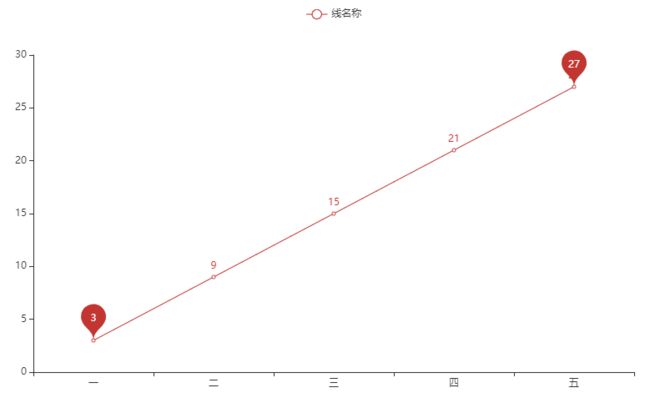
(3)标记最大最小值
'''
以折线图为例
'''
line.set_series_opts(markpoint_opts=opts.MarkPointOpts(data=[opts.MarkPointItem(type_="max", name="最大值"),
                                                             opts.MarkPointItem(type_="min", name="最小值")]))
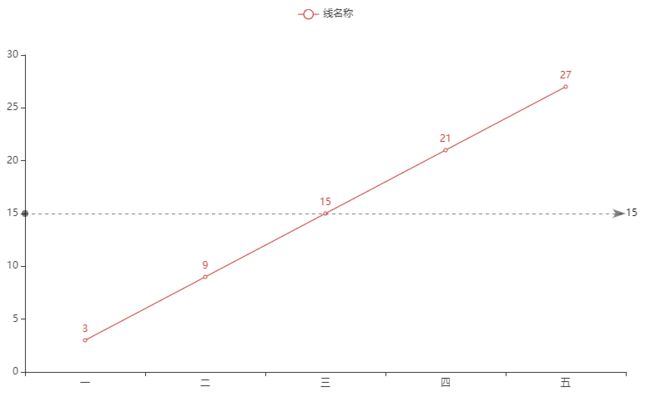
(4)平均值标线
'''
以折线图为例
'''
line.add_yaxis(
    		   "线名称", ylist, is_smooth=True,
               markline_opts=opts.MarkLineOpts(
                   								data=[opts.MarkLineItem(type_='average', name='平均值')]
                                               , linestyle_opts=opts.LineStyleOpts(
                                                   									type_='dashed' # 点状
                                                                                   , opacity=0.5  # 透明度0-1值越小越透明
                                                                                   , color='black'
                                               									  )
                                              )
              )
(5)保存为其他格式到本地
'''
已折线图为例,除备注两行外其他代码与之前相同(注意需要引入两个库)
'''
from pyecharts import options
from pyecharts.charts import Line
from snapshot_selenium import snapshot
from pyecharts.render import make_snapshot


def draw(xlist, ylist):
    line = Line(init_opts=options.InitOpts(bg_color='#ffffff'))	# 背景色更改为白色,默认为透明
    line.add_xaxis(xlist)
    line.add_yaxis("线名称", ylist, is_smooth=True)
    line.set_global_opts(title_opts=options.TitleOpts(title='name'))
    make_snapshot(snapshot, line.render(), "xxx.png")	# 生成png格式文件


def main():
    xlist = ['一', '二', '三', '四', '五']
    ylist = [3, 9, 15, 21, 27]
    draw(xlist, ylist)


if __name__ == '__main__':
    main()

