机器学习8-决策树
决策树(Decision Tree)是一种强大且灵活的机器学习算法,可用于分类和回归问题。它通过从数据中学习一系列规则来建立模型,这些规则对输入数据进行递归的分割,直到达到某个终止条件。
决策树的构建过程:
1. 选择特征:从所有特征中选择一个最佳的分裂标准,以将数据集分成两个子集。
2. 分裂数据:使用选定的特征和分裂标准将数据集分成两个子集。这个过程会递归地应用于每个子集,形成树的分支。
3. 终止条件:在每个节点处,都会检查是否满足某个终止条件,例如节点中的样本数量小于阈值,或者树的深度达到预定的最大深度。
4. 重复:重复上述步骤,不断分裂和构建树,直到达到终止条件。
决策树的特点:
1. 可解释性:决策树的规则易于理解,可视化呈现直观的分裂过程,使决策过程变得透明。
2. 适应性:能够适应不同类型的数据,包括离散型和连续型特征。
3. 非参数性:不对数据的分布做出具体假设,因此对于不同类型的数据集都具有灵活性。
4. 特征重要性:决策树可以提供每个特征的重要性,帮助识别影响预测的关键因素。
5. 处理缺失值:能够处理缺失值,不需要对数据进行特殊的处理。
应用领域:
- 分类问题:例如,判断邮件是否为垃圾邮件、病患是否患有某种疾病等。
- 回归问题:预测房价、销售额等连续性输出的问题。
- 特征选择:通过查看特征的重要性,可以辅助进行特征选择。
- 异常检测:可用于检测数据中的异常值。
决策树的一个主要缺点是容易过拟合,特别是当树的深度很大时。为了缓解过拟合,可以通过剪枝等技术来调整树的复杂度。
需求:
判断用户是否会购买SUV
代码:
# Decision Tree Classification

### Importing the libraries
import numpy as np
import matplotlib.pyplot as plt
import pandas as pd


### Importing the dataset
dataset = pd.read_csv('Social_Network_Ads.csv')
X = dataset.iloc[:, [2, 3]].values
y = dataset.iloc[:, 4].values

### Splitting the dataset into the Training set and Test set
from sklearn.model_selection import train_test_split
X_train, X_test, y_train, y_test = train_test_split(X, y, test_size = 0.25, random_state = 0)


### Feature Scaling
from sklearn.preprocessing import StandardScaler
sc = StandardScaler()
X_train = sc.fit_transform(X_train)
X_test = sc.transform(X_test)

### Fitting Decision Tree Classification to the Training set
from sklearn.tree import DecisionTreeClassifier
classifier = DecisionTreeClassifier(criterion = 'entropy', random_state = 0)
classifier.fit(X_train, y_train)

### Predicting the Test set results
y_pred = classifier.predict(X_test)

### Making the Confusion Matrix
from sklearn.metrics import confusion_matrix
cm = confusion_matrix(y_test, y_pred)

# Visualising the Training set results
from matplotlib.colors import ListedColormap
X_set, y_set = X_train, y_train
X1, X2 = np.meshgrid(np.arange(start = X_set[:, 0].min() - 1, stop = X_set[:, 0].max() + 1, step = 0.01),
                     np.arange(start = X_set[:, 1].min() - 1, stop = X_set[:, 1].max() + 1, step = 0.01))
plt.contourf(X1, X2, classifier.predict(np.array([X1.ravel(), X2.ravel()]).T).reshape(X1.shape),
             alpha = 0.75, cmap = ListedColormap(('red', 'green')))
plt.xlim(X1.min(), X1.max())
plt.ylim(X2.min(), X2.max())
for i, j in enumerate(np.unique(y_set)):
    plt.scatter(X_set[y_set == j, 0], X_set[y_set == j, 1],
                c = ListedColormap(('red', 'green'))(i), label = j)
plt.title('Decision Tree Classification (Training set)')
plt.xlabel('Age')
plt.ylabel('Estimated Salary')
plt.legend()
plt.show()

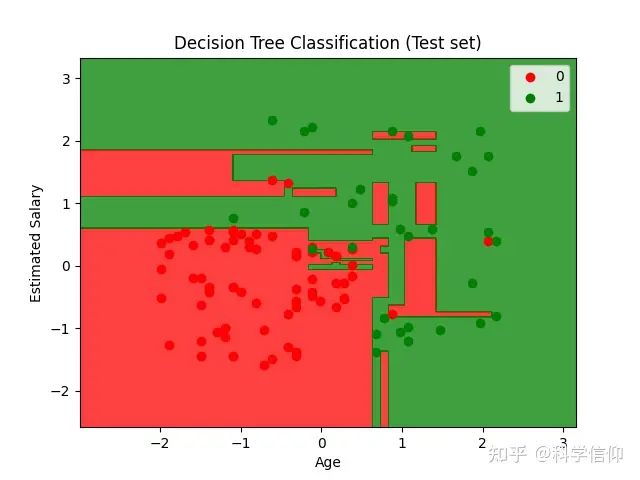
# Visualising the Test set results
from matplotlib.colors import ListedColormap
X_set, y_set = X_test, y_test
X1, X2 = np.meshgrid(np.arange(start = X_set[:, 0].min() - 1, stop = X_set[:, 0].max() + 1, step = 0.01),
                     np.arange(start = X_set[:, 1].min() - 1, stop = X_set[:, 1].max() + 1, step = 0.01))
plt.contourf(X1, X2, classifier.predict(np.array([X1.ravel(), X2.ravel()]).T).reshape(X1.shape),
             alpha = 0.75, cmap = ListedColormap(('red', 'green')))
plt.xlim(X1.min(), X1.max())
plt.ylim(X2.min(), X2.max())
for i, j in enumerate(np.unique(y_set)):
    plt.scatter(X_set[y_set == j, 0], X_set[y_set == j, 1],
                c = ListedColormap(('red', 'green'))(i), label = j)
plt.title('Decision Tree Classification (Test set)')
plt.xlabel('Age')
plt.ylabel('Estimated Salary')
plt.legend()
plt.show()
结果:
结论:
预测准确度还是比较高的。

