Using Developer Dashboard in SharePoint 2010
What Is Developer Dashboard
Developer Dashboard是SharePoint2010提供的一个新功能,它可以在当前页面生成时(rendering)提供额外的性能信息和一些跟踪信息,帮助开发人员调试页面组件,监控页面上各组件代码的性能,帮助寻找页面可能的效率瓶颈根源。这对于有包含客户代码的页面时非常方便和有效。当Developer Dashboard被启用时,你可以在页面的底部得到页面在生成过程中有关控件加载、查询及执行时间的各种数据信息。这些信息包括:
- 哪些控件被加载
- 加载每个控件的时间
- 数据库查询以及执行时间
- 加载页面所触发的事件
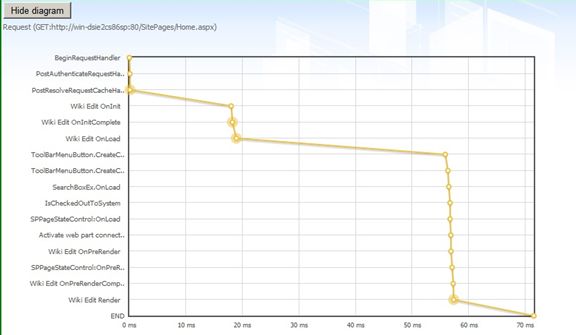
- 加载页面各个阶段的时间
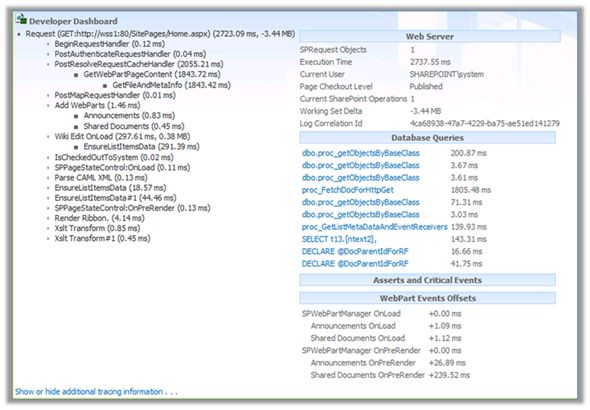
正如上图所示,这些跟踪信息都是基于页面上各个组件被加载的时间线和页面生命周期为时间线来组织的,清楚的描述了各个事件所消耗的时间及针对web服务器和数据库服务器的消耗。并且在Database Queries部分你可以很容易的看到具体执行的数据库查询以及所消耗的时间。这些以时间线为顺序的监控信息可以很容易的帮助您调试或寻找问题。
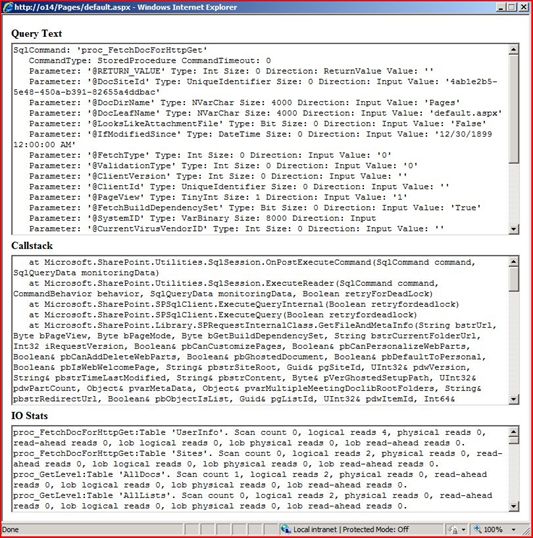
你可能还注意到了Database Queries部分是可以点击的。当点击进入任何一个被执行的数据查询,你会看到有关该SQL调用的上下文及调用堆栈,以及IO开销等。
How to enable Developer Dashboard
-
编程实现:
创建一个基于.NET Framework 3.5的控制台程序,并将build设置为Any CPU(因为SharePoint是x64的)。拷贝下列代码:
| SPPerformanceMonitor perfmon = SPFarm.Local.PerformanceMonitor; perfmon.DeveloperDashboardLevel = SPPerformanceMonitoringLevel.On; perfmon.Update(); |
编译并执行,OK。
-
命令行实现:
在以Administrator身份运行的Command Line中执行下述命令:
| Stsadm –o setproperty –pn developer-dashboard –pv ondemand (or "on" or "off") |
当你将它设置为OnDemand时,网站管理员可以选择打开或者关闭。这样网站管理员可以选择打开或关闭特定网站集的监控输出,这将作为故障排除工具之针对特定的人群。
一切似乎很好,所有WebPart和代码只要在页面内运行,都将有输出信息作为排除故障的工具,但很不幸的,你看到上图中的信息量了吗?很多,其实很不方便查找特定的事件和故障。你的代码中对于OnInit和Render方法的重写都会被自动的捕捉到,但是其余地方的代码却不会被发现。SPMonitoredScope可以帮助你track更多的代码并输出到Developer Dashboard中。
Using SPMonitoredScope to monitor performance of your code
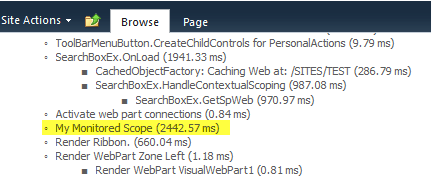
使用SPMonitoredScope可以很方便的将某段代码的相关性能信息输出到Developer Dashboard中。使用SPMonitoredScope很简单,首先声明一个SPMonitoredScope的实例并赋予一个可以追踪的名字,将需要Track的代码写入即可。例如,下边的代码演示了插入一个列表项:
| using (SPMonitoredScope monitoredScope = new SPMonitoredScope("My Monitored Scope")) { // put code to monitor performance on here SPList testList = site.Lists.TryGetList("Test List"); if (testList != null) { SPListItem listItem = testList.Items.Add(); listItem["Title"] = string.Format("Test Item {0}", Guid.NewGuid().ToString()); listItem["City"] = "Somewhere"; listItem["Quantity"] = 3; listItem.Update(); } } |
以上代码将会在Developer Dashboard中显示其执行的性能信息:
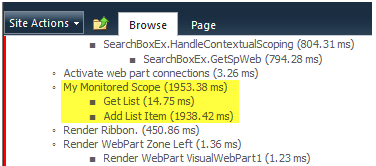
在SPMonitoredScope中你还可以嵌套使用SPMonitoredScope对象以更详细的监控尽可能小的代码段来分析器性能。
| using (SPMonitoredScope monitoredScope = new SPMonitoredScope("My Monitored Scope")) { SPList testList;
using (SPMonitoredScope getListMonitor = new SPMonitoredScope("Get List")) { testList = site.Lists.TryGetList("Test List"); }
using (SPMonitoredScope addListItemMonitor = new SPMonitoredScope("Add List Item")) { if (testList != null) { SPListItem listItem = testList.Items.Add(); listItem["Title"] = string.Format("Test Item {0}", Guid.NewGuid().ToString()); listItem["City"] = "Somewhere"; listItem["Quantity"] = 3; listItem.Update(); } } } |
正如期望的,我们在My Monitored Scope中看到了更为详细的监控段Get List和Add List Item。这样就能很清楚的看到每个代码段的性能情况。
SharePoint 2010 Developer Dashboard Visualizer
SharePoint 2010 Developer Dashboard Visuallizer是基于jQuery的扩展Developer Dashboard的插件,它通过可视化的图形界面让你更清楚的看到代码的性能情况。
Have FunJ