How to debug Android Native Application with eclipse
This blog is inspired by this tutorial http://mhandroid.wordpress.com/2011/01/23/using-eclipse-for-android-cc-debugging/, but that tutorial is for NDK. However what I am doing is a pure Native debugging (AOSP 4.2.2 + a Pure Native C++ application, so it is not NDK based, but a pure C++ application which has real main() function). The steps for debugging setup are as following:
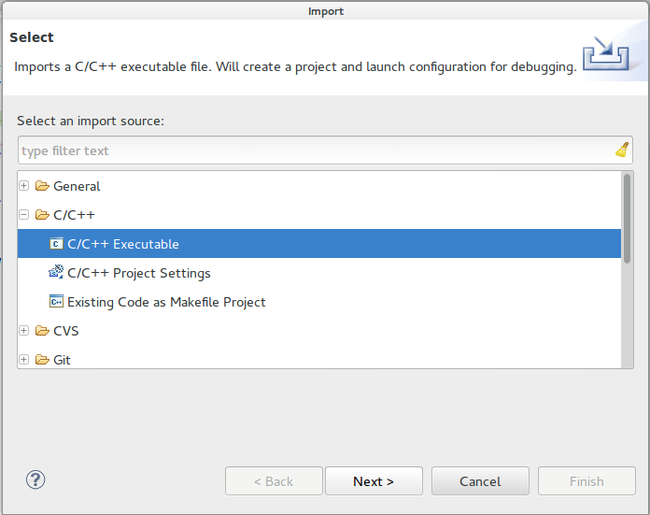
1) Since my applicaton is pure C++ application which is like the Android bootanimation, I build it from the AOSP command line, not from eclipse, so when I want to debug it, I have to import the executable from filesystem.
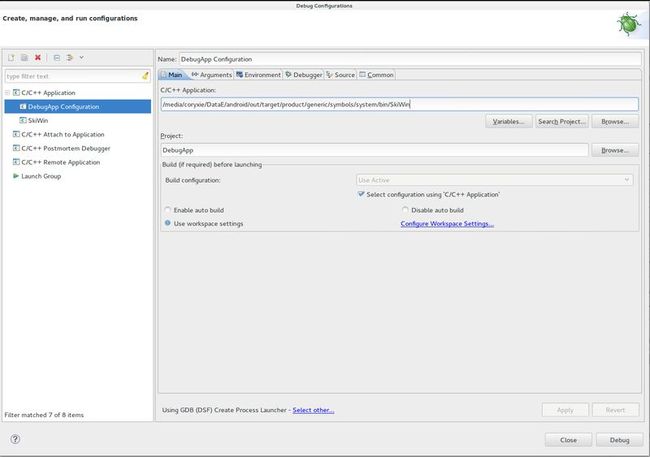
2) When the project is created, create a Debug configuration (select the project, then right click, then select "Debug As"). When the "Debug Configurations" diaglog appears, add/select the entry for your debugging application; Then in the "Main" tab, choose the applicaton path by clicking the "Browse" button:
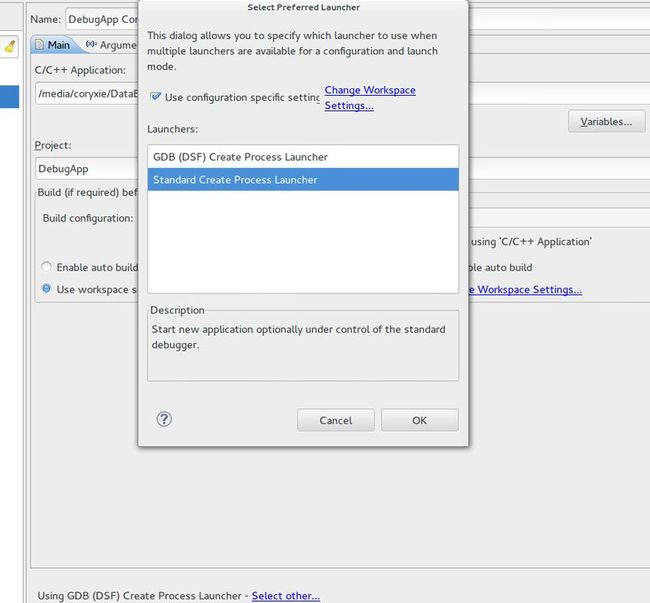
3) By default, the eclipse will use "GDB (DSF) Create Process Launcher", we must change the launcher, to do this, in the bottom of the "Main" tab, click the "Using GDB (DSF) Create Process Launcher - Select other..." button, and then select "Standard Create Process Launcher". This is very important, becasue the next steps will need this step to populate the "Debugger" tab contents. If you do not change this, then the "Debugger" tab will not be what we will see in the next step.
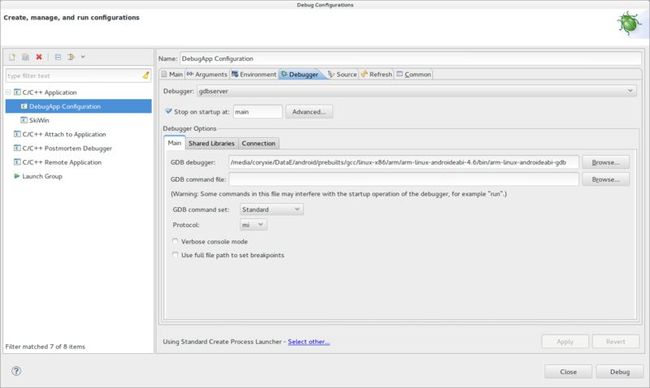
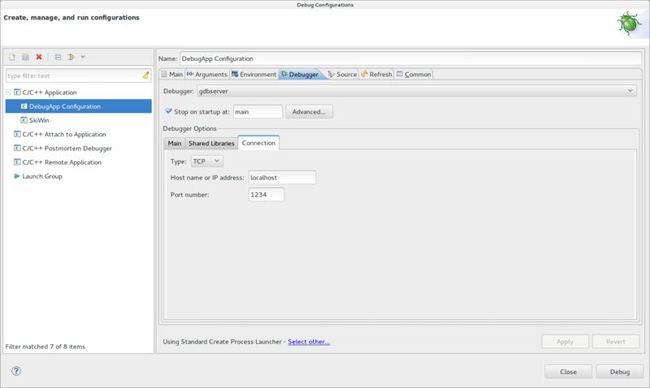
4) Switch to the "Debugger" tab, then fill the fileds contents as bellow:
5) Change to the "Connection" sub tab of the "Debugger" tab, and change the connection settings as below (which will need to match the gdbserver settings as done in the next step):
6) Click the "Apply" button;
7) Before you click the "Debug" button, you need to:
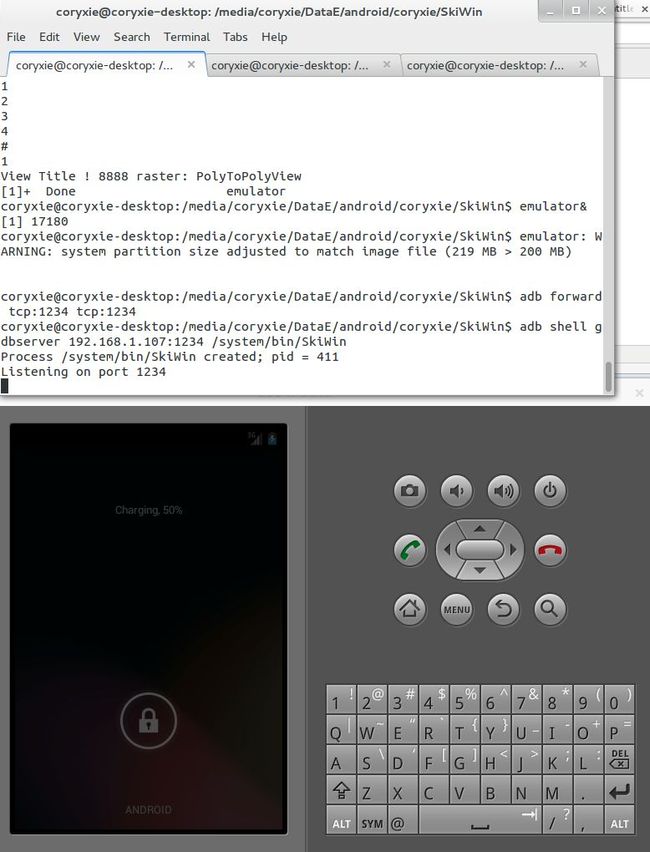
a) start the Android emulator: emultator &
b) farward tcp port: adb forward tcp:1234 tcp:1234
c) start gdb server: adb shell gdbserver 192.168.1.107:1234 /system/bin/SkiWin
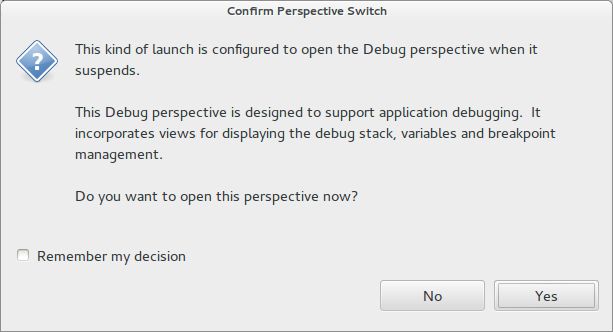
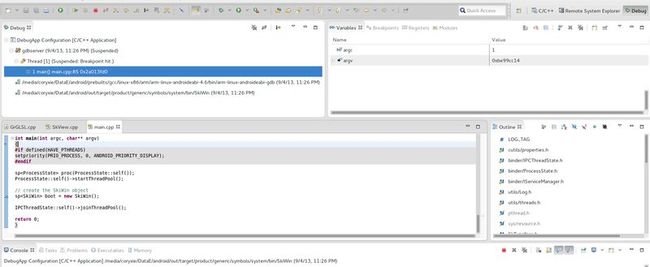
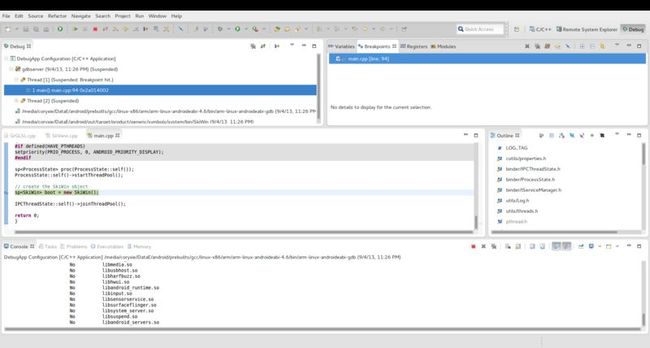
8) Now its time to start the Debugging by clicking the "Debug" button. Once clicked, eclipse will use the gdb (such as prebuilt/linux-x86/bin/arm-linux-androideabi-gdb which you have choosen in the previous steps) to connect the gdbserver, once connected, it will switch to the "Debug perspective". When you choose "Yes", you will see the dynamic libs are loaded in the eclipse console, and then the source code is stopped/displayed on the main() function (as you have requested this in the previous steps in the Debugger configuration).
9) Now, its time to start the application, of course, you could set some breakpoints before you go. For example, I have set a breakpoint as below, and when I click the "Resume (F8)" button, the code runs to the breakpoint as below (meanwhile, dynamic libs are loaded when it is first time loaded):
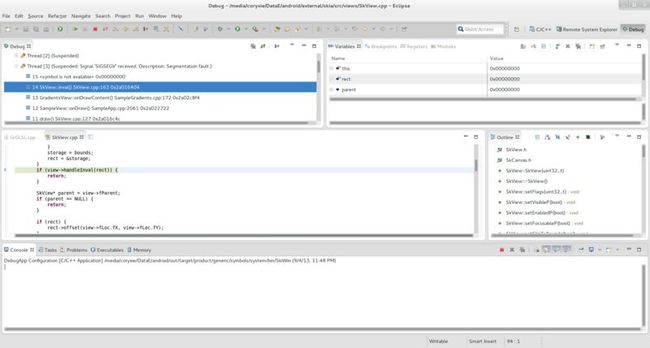
10) Since I am going to catch and debug a "Segmentation Fault" in the code (AOSP skia), I am going to run the applicaton in full speed and perform some operations before it triggers the fault (or anytime something went wrong and want to have a peek of what is going on). For the fault, the debugger will automatically stop at the code where it triggers; for the situation where you don't know what is going on, but want to have an on-line check, you need to click the "Suspend" button.
11) What is now remaining is to do normal debugging, checking variables, registers, etc. In my unlucky case, it is clear the "view->handleInval" is a NULL pointer, which causes a jump to zero (thus a Segmentation Fault) - shit, why would this be happening (since there is actually a SkView::handleInval() method)?! Anyway, it is my homework to do this checking!
Hope it helps someone someday!
Cory
