【百度地图API】如何自定义地图图层?实例:制作麻点图(自定义图层+热区)
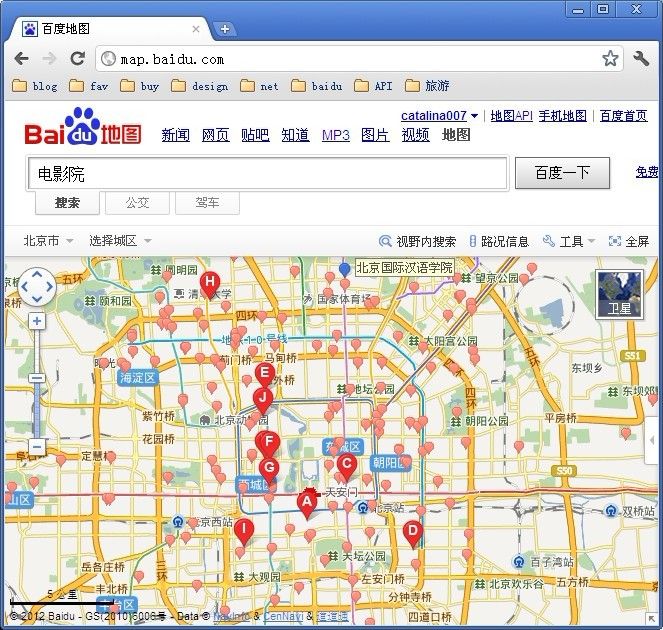
摘要:自定义地图图层的用途十分广泛。常见的应用,比如制作魔兽地图和清华校园地图(使用切图工具即可轻松实现)。今天我们来学习,当地图上有大量标注,比如600万个的时候,我们如何用“麻点图”来实现标注的展示。
----------------------------------------------------------------------------------------------------------
“麻点图”展示图,如下图所示:

“麻点图”实现原理:
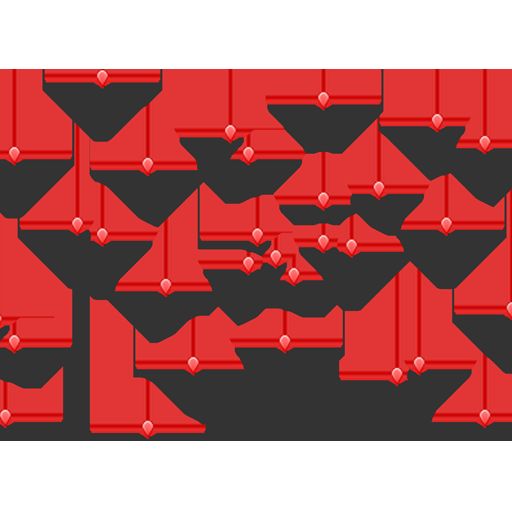
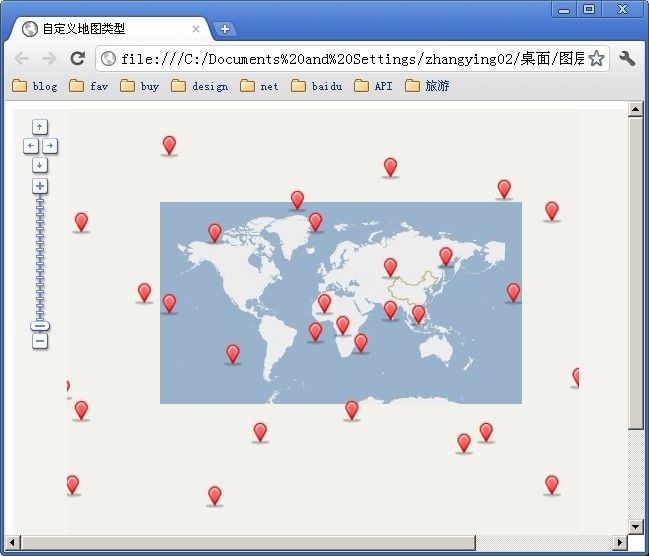
1、将麻点做在同一张图片上,然后利用自定义图层接口,将麻点图贴在地图底图上;
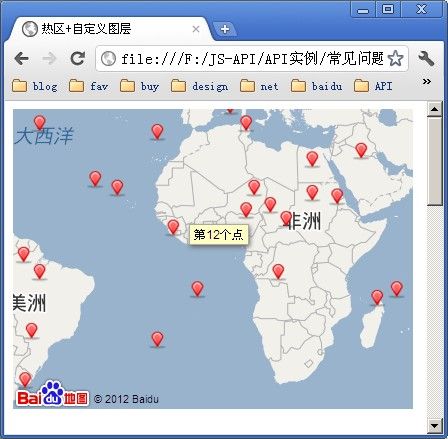
2、然后利用热区接口,使鼠标放在热点上,有文字显示。
3、可以自己加上信息窗口等覆盖物,让热区hotspot看起来像标注marker一样。
根据地图级别确定图块总面积
一个图块是256*256的图片构成的。
当地图为1级时,整个地图由4张图片构成,如下图(中心点为0,0):

所以图层的长宽为512*512。如下图:

将此图裁成4块,贴到地图底图上。

同理,其他地图级别、图块数量和图块总面积的关系如下表:
地图级别 图块数量 图块总面积 备注
1 2*2=4 512*512 2^1=2, 2^2=4, 256*2=512
2 4*4=16 1024*1024 2^2=4, 4^2=16, 256*4=1024
3 8*8=64 4096*4096 2^3=8, 8^2=64, 256*8=2046
4 16*16=256 ……
zoom (2^zoom)^2 (256*(zoom^2))^2
以zoom=3为例,制作热区。
使用自定义图层的方法,将麻点图贴到地图上。
var tileLayer = new BMap.TileLayer({isTransparentPng: true});
tileLayer.getTilesUrl = function(tileCoord, zoom) {
    var x = tileCoord.x;
    var y = tileCoord.y;
    return 'tiles/' + zoom + '/tile' + x + '_' + y + '.png';
}
然后为每一个麻点添加一个热区。(示例中只添加了可视区域内的21个麻点)
//创建热区
var p1 = new BMap.Point(-53.278572,36.83958);
var h1 = new BMap.Hotspot(p1, {text: "第1个点"});
map.addHotspot(h1);
最终效果图:(用此方法,可以添加600万个以上的热区哦~)

全部源代码:
<!DOCTYPE html>
<html>
<head>
<meta http-equiv="Content-Type" content="text/html; charset=utf-8" />
<title>热区+自定义图层</title>
<script type="text/javascript" src="http://api.map.baidu.com/api?v=1.2"></script>
</head>
<body>
<div id="map" style="width:400px;height:300px"></div>
<div id="info" style="width:400px;height:800px"></div>
<script type="text/javascript">
var tileLayer = new BMap.TileLayer({isTransparentPng: true});
tileLayer.getTilesUrl = function(tileCoord, zoom) {
    var x = tileCoord.x;
    var y = tileCoord.y;
    return 'tiles/' + zoom + '/tile' + x + '_' + y + '.png';
}
var map = new BMap.Map('map');
map.addTileLayer(tileLayer);
//map.addControl(new BMap.NavigationControl());
map.centerAndZoom(new BMap.Point(0, 0), 3);

//点击获取屏幕经纬度
map.addEventListener("click",function(e){
    document.getElementById("info").innerHTML += e.point.lng + "," + e.point.lat + "</br>";
});

//创建热区
var p1 = new BMap.Point(-53.278572,36.83958);
var h1 = new BMap.Hotspot(p1, {text: "第1个点"});
map.addHotspot(h1);

var p2 = new BMap.Point(-14.717837,35.647352);
var h2 = new BMap.Hotspot(p2, {text: "第2个点"});
map.addHotspot(h2);

var p3 = new BMap.Point(9.713773,36.126444);
var h3 = new BMap.Hotspot(p3, {text: "第3个点"});
map.addHotspot(h3);

var p4 = new BMap.Point(43.564799,30.699049);
var h4 = new BMap.Hotspot(p4, {text: "第4个点"});
map.addHotspot(h4);

var p5 = new BMap.Point(30.024388,29.418746);
var h5 = new BMap.Hotspot(p5, {text: "第5个点"});
map.addHotspot(h5);

var p6 = new BMap.Point(29.141318,18.90614);
var h6 = new BMap.Hotspot(p6, {text: "第6个点"});
map.addHotspot(h6);

var p7 = new BMap.Point(37.677664,17.781705);
var h7 = new BMap.Hotspot(p7, {text: "第7个点"});
map.addHotspot(h7);

var p8 = new BMap.Point(21.488043,10.607121);
var h8 = new BMap.Hotspot(p8, {text: "第8个点"});
map.addHotspot(h8);

var p9 = new BMap.Point(16.189621,15.225979);
var h9 = new BMap.Hotspot(p9, {text: "第9个点"});
map.addHotspot(h9);

var p10 = new BMap.Point(11.77427,14.939957);
var h10 = new BMap.Hotspot(p10, {text: "第10个点"});
map.addHotspot(h10);

var p11 = new BMap.Point(11.77427,20.855394);
var h11 = new BMap.Hotspot(p11, {text: "第11个点"});
map.addHotspot(h11);

var p12 = new BMap.Point(-10.596843,8.562041);
var h12 = new BMap.Hotspot(p12, {text: "第12个点"});
map.addHotspot(h12);

var p13 = new BMap.Point(-27.669534,21.131844);
var h13 = new BMap.Hotspot(p1, {text: "第13个点"});
map.addHotspot(h13);

var p14 = new BMap.Point(-36.20588,23.866825);
var h14 = new BMap.Hotspot(p14, {text: "第14个点"});
map.addHotspot(h14);

var p15 = new BMap.Point(-15.600908,-23.866825);
var h15 = new BMap.Hotspot(p15, {text: "第15个点"});
map.addHotspot(h15);

var p16 = new BMap.Point(-4.709708,-10.024106);
var h16 = new BMap.Hotspot(p16, {text: "第16个点"});
map.addHotspot(h16);

var p17 = new BMap.Point(19.427545,-4.145408);
var h17 = new BMap.Hotspot(p17, {text: "第17个点"});
map.addHotspot(h17);

var p18 = new BMap.Point(47.09708,-13.50419);
var h18 = new BMap.Hotspot(p18, {text: "第18个点"});
map.addHotspot(h18);

var p19 = new BMap.Point(55.633426,-8.854941);
var h19 = new BMap.Hotspot(p19, {text: "第19个点"});
map.addHotspot(h19);

var p20 = new BMap.Point(-57.105209,2.370216);
var h20 = new BMap.Hotspot(p20, {text: "第20个点"});
map.addHotspot(h20);

var p21 = new BMap.Point(-48.274507,-4.736327);
var h21 = new BMap.Hotspot(p21, {text: "第21个点"});
map.addHotspot(h21);

var p22 = new BMap.Point(-56.222139,-30.699049);
var h22 = new BMap.Hotspot(p22, {text: "第22个点"});
map.addHotspot(h22);
</script>
</body>
</html>
附录:
获取地图上的经纬度
可以使用以下代码获取地图上任意点的经纬度。
//点击获取屏幕经纬度
map.addEventListener("click",function(e){
    document.getElementById("info").innerHTML += e.point.lng + "," + e.point.lat + "</br>";
});
大量标注会使地图变慢,如何解决?
标注数据量请控制在150个以内,以保持各个浏览器都能高性能地展示地图;标注数量在260以内,可以使用自定义覆盖物实现;标注数量大于300个,建议尝试marker聚合,或者数据抽希,或者热区。
Marker聚合:http://tieba.baidu.com/f?kz=1031097376
数据抽希:比如有10个marker,选择其中6个做为显示点。
热区:如本例。
建议不要一次在地图上添加过多的marker,而是先把point存储在数据库里,当需要显示某个marker是,再addOverlay。如《显示可视区域内的标注》;http://www.cnblogs.com/milkmap/archive/2012/02/02/2335989.html
-----------------------------------------------------------------------------------------
关于屏幕像素,图块图号,经纬度之间的转换,请查看此篇文章《百度地图API详解之地图坐标系统》http://www.cnblogs.com/jz1108/archive/2011/07/02/2095376.html
涉及到以下坐标系:
- 经纬度:通过经度(longitude)和纬度(latitude)描述的地球上的某个位置。
- 平面坐标:投影之后的坐标(用x和y描述),用于在平面上标识某个位置。
- 像素坐标:描述不同级别下地图上某点的位置。
- 图块坐标:地图图块编号(用x和y描述)。
- 可视区域坐标:地图可视区域的坐标系(用x和y描述)。
- 覆盖物坐标:覆盖物相对于容器的坐标(用x和y描述)。
计算方式:
  var lngLat = e.point;

  var lngLatStr = "经纬度:" + lngLat.lng + ", " + lngLat.lat;


  var worldCoordinate = projection.lngLatToPoint(lngLat);

  var worldCoordStr = "<br />平面坐标:" + worldCoordinate.x + ", " + worldCoordinate.y;


  var pixelCoordinate = new BMap.Pixel(Math.floor(worldCoordinate.x * Math.pow(2, this.getZoom() - 18)),

                                       Math.floor(worldCoordinate.y * Math.pow(2, this.getZoom() - 18)));

  var pixelCoordStr = "<br />像素坐标:" + pixelCoordinate.x + ", " + pixelCoordinate.y;


  var tileCoordinate = new BMap.Pixel(Math.floor(pixelCoordinate.x / 256),

                                 Math.floor(pixelCoordinate.y / 256));

  var tileCoordStr = "<br />图块坐标:" + tileCoordinate.x + ", " + tileCoordinate.y;


  var viewportCoordinate = map.pointToPixel(lngLat);

  var viewportCoordStr = "<br />可视区域坐标:" + viewportCoordinate.x + ", " + viewportCoordinate.y;


  var overlayCoordinate = map.pointToOverlayPixel(lngLat);

  var overlayCoordStr = "<br />覆盖物坐标:" + overlayCoordinate.x + ", " + overlayCoordinate.y;