Silverlight Chart 综合运用(样式、多轴、数据绑定、点状图、线形图、DataGrid、Chart导出综合运用)
前面的文章,我们已经介绍过样式、数据绑定、点状图、线形图在Silverlight中的基本运用方法。这一章,我们将之前的内容融合起来,并进行一定的扩展。
在下面,我们将实现下图功能:
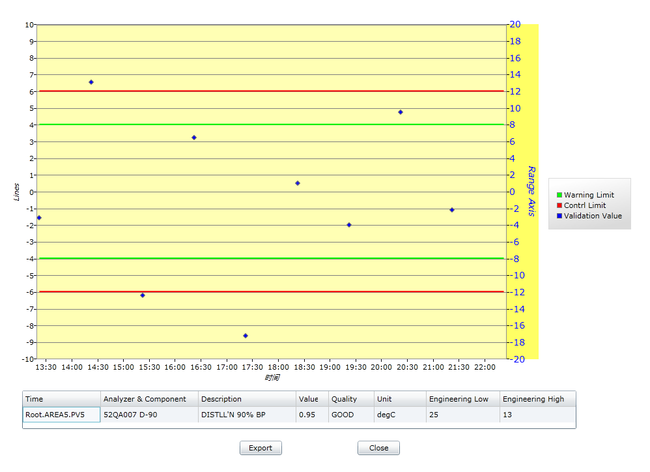
该图呈现的是一个典型的SQC图(Statistical Quality Control) 图中包含以下内容:
1、Chart、Legend、点、线、的样式设置。
2、多Y轴。图中设置了两个Y轴,第一轴(左) 与数据标准线绑定,显示标准值区间。第二轴(右)与采样点绑定,显示采样数值区间。取样数据。
3、Chart中的Series_SelectionChanged事件,与DataGrid联动。
4、数据标准线。本图中有四条,分别为Warning Limit Up/Warning Limit Low 和 Control Limit Up/Control Limit Low。
5、图中显示了被选择的8个采样点,他们的值分别分布在被数据标准线划分的几个区间内。
6、Chart的导出。(导出功能的实现请看这里)
第一步:在页面上加载需要的控件
我们在页面上放置一个Chart控件,一个DataGrid,一对Button,然后对Chart的每个列进行数据绑定设置。
< navigation:Page
xmlns ="http://schemas.microsoft.com/winfx/2006/xaml/presentation"
xmlns:x ="http://schemas.microsoft.com/winfx/2006/xaml"
xmlns:d ="http://schemas.microsoft.com/expression/blend/2008"
xmlns:mc ="http://schemas.openxmlformats.org/markup-compatibility/2006"
mc:Ignorable ="d"
xmlns:navigation ="clr-namespace:System.Windows.Controls;assembly=System.Windows.Controls.Navigation"
x:Class ="MySilverlightTest.Control_ChartMultipleAxis"
Title =""
d:DesignWidth ="1024" d:DesignHeight ="768"
xmlns:sdk ="http://schemas.microsoft.com/winfx/2006/xaml/presentation/sdk"
xmlns:toolkit ="http://schemas.microsoft.com/winfx/2006/xaml/presentation/toolkit"
xmlns:toolkitChart ="clr-namespace:System.Windows.Controls.DataVisualization.Charting;assembly=System.Windows.Controls.DataVisualization.Toolkit"
>
< Grid x:Name ="LayoutRoot" >
< Grid.RowDefinitions >
< RowDefinition Height ="493*" />
</ Grid.RowDefinitions >
< toolkitChart:Chart Height ="620" HorizontalAlignment ="Left" Margin ="12,16,0,0" Name ="chart" VerticalAlignment ="Top" Width ="987" BorderThickness ="0" ></ toolkitChart:Chart >
< sdk:DataGrid IsReadOnly ="True" ItemsSource =" {Binding} " AutoGenerateColumns ="False" HorizontalAlignment ="Left" Name ="dataGrid1" Width ="851" Margin ="39,623,0,0" CanUserReorderColumns ="False" CanUserResizeColumns ="True" CanUserSortColumns ="False" ColumnWidth ="100" Height ="59" VerticalAlignment ="Top" >
< sdk:DataGrid.Columns >
< sdk:DataGridTextColumn Binding =" {Binding Local} " CanUserReorder ="True" CanUserResize ="True" CanUserSort ="True" Header ="Time" Width ="120" />
< sdk:DataGridTextColumn Binding =" {Binding AnalyzerComponent} " CanUserReorder ="True" CanUserResize ="True" CanUserSort ="True" Header ="Analyzer & Component" Width ="150" />
< sdk:DataGridTextColumn Binding =" {Binding Description} " CanUserReorder ="True" CanUserResize ="True" CanUserSort ="True" Header ="Description" Width ="150" />
< sdk:DataGridTextColumn Binding =" {Binding Value} " CanUserReorder ="True" CanUserResize ="True" CanUserSort ="True" Header ="Value" Width ="50" />
< sdk:DataGridTextColumn Binding =" {Binding Quality} " CanUserReorder ="True" CanUserResize ="True" CanUserSort ="True" Header ="Quality" Width ="70" />
< sdk:DataGridTextColumn Binding =" {Binding Unit} " CanUserReorder ="True" CanUserResize ="True" CanUserSort ="True" Header ="Unit" Width ="80" />
< sdk:DataGridTextColumn Binding =" {Binding EngineeringLow} " CanUserReorder ="True" CanUserResize ="True" CanUserSort ="True" Header ="Engineering Low" Width ="Auto" />
< sdk:DataGridTextColumn Binding =" {Binding EngineeringHigh} " CanUserReorder ="True" CanUserResize ="True" CanUserSort ="True" Header ="Engineering High" Width ="Auto" />
</ sdk:DataGrid.Columns >
</ sdk:DataGrid >
< Button Content ="Export" Height ="22" HorizontalAlignment ="Left" Margin ="373,700,0,0" Name ="btnExport" VerticalAlignment ="Top" Width ="65" Click ="btnExport_Click" />
< Button Content ="Close" Height ="22" HorizontalAlignment ="Left" Margin ="554,700,0,0" Name ="btnClose" VerticalAlignment ="Top" Width ="65" />
</ Grid >
</ navigation:Page >
然后就需要在后台对数据以及Chart中的各各对象进行设置了。
为点、线、Chart、第二Y轴、Legend定义样式 (关于样式的基本使用方法请看这里和这里)
    1

   //

   Chart样式


    2


    Style ChartAreaStyle

   =


   new

    System.Windows.Style();


    3

    ChartAreaStyle.TargetType

   =


   typeof

   (System.Windows.Controls.Grid);


    4


    5


   //

   分别对四条线(两种类型)设置样式


    6


    Style controlLimitStyle

   =


   new

    System.Windows.Style();


    7

    controlLimitStyle.TargetType

   =


   typeof

   (System.Windows.Controls.Control);


    8


    9

    Style warningLimitStyle

   =


   new

    System.Windows.Style();


   10

    warningLimitStyle.TargetType

   =


   typeof

   (System.Windows.Controls.Control);


   11


   12


   //

   设置线形图中点的样式


   13


    Style dataPointStyle

   =


   new

    System.Windows.Style();


   14

    dataPointStyle.TargetType

   =


   typeof

   (System.Windows.Controls.Control);


   15


   16

    Style hideStyle

   =


   new

    System.Windows.Style();


   17

    hideStyle.TargetType

   =


   typeof

   (System.Windows.Controls.Control);


   18


   19


   //

   设置时间的显示格式


   20


    Style timeStyle

   =


   new

    System.Windows.Style();


   21

    timeStyle.TargetType

   =


   typeof

   (System.Windows.Controls.Control);


   22


   23


   //

   为Style设置Setter


   24


    Setter controlLimitsetterTemplate

   =


   new

    Setter(System.Windows.Controls.Control.TemplateProperty,

   null

   );


   25

    Setter warningLimitsetterTemplate

   =


   new

    Setter(System.Windows.Controls.Control.TemplateProperty,

   null

   );


   26

    Setter setterBlue

   =


   new

    Setter(System.Windows.Controls.Control.BackgroundProperty,

   new

    SolidColorBrush(Colors.Blue));


   27

    Setter setterGreen

   =


   new

    Setter(System.Windows.Controls.Control.BackgroundProperty,

   new

    SolidColorBrush(Color.FromArgb(

   255

   ,

   0

   ,

   255

   ,

   0

   )));


   28

    Setter setterRed

   =


   new

    Setter(System.Windows.Controls.Control.BackgroundProperty,

   new

    SolidColorBrush(Colors.Red));


   29

    Setter setterHide

   =


   new

    Setter(System.Windows.Controls.Control.VisibilityProperty, Visibility.Collapsed);


   30

    Setter setterArea

   =


   new

    Setter(Grid.BackgroundProperty,

   new

    SolidColorBrush(Color.FromArgb(

   255

   ,

   255

   ,

   255

   ,

   180

   )));


   31

    Setter setterTime

   =


   new

    Setter(AxisLabel.StringFormatProperty,

   "

   {0:HH:mm}

   "

   );


   32


   33

    dataPointStyle.Setters.Add(setterBlue);


   34

    warningLimitStyle.Setters.Add(warningLimitsetterTemplate);


   35

    controlLimitStyle.Setters.Add(controlLimitsetterTemplate);


   36

    warningLimitStyle.Setters.Add(setterGreen);


   37

    controlLimitStyle.Setters.Add(setterRed);


   38

    hideStyle.Setters.Add(setterHide);


   39

    ChartAreaStyle.Setters.Add(setterArea);


   40

    timeStyle.Setters.Add(setterTime);
定义X轴,Y轴和第二Y轴。
    1

   //

   定义X轴


    2


    IAxis dateAxis

   =


   new

    DateTimeAxis { Orientation

   =

    AxisOrientation.X, Title

   =


   "

   时间

   "

   , IntervalType

   =

    DateTimeIntervalType.Minutes, Interval

   =


   30

   , AxisLabelStyle

   =

    timeStyle };


    3


   //

   定义Y轴


    4


    IAxis valueAxis

   =


   new

    LinearAxis { Orientation

   =

    AxisOrientation.Y, Location

   =

    AxisLocation.Left, Title

   =


   "

   Lines

   "

   , Minimum

   =


   -

   10

   , Maximum

   =


   10

   , ShowGridLines

   =


   true

    };


    5


   //

   定义需要绑定的轴


    6


    IRangeAxis rangeAxis

   =


   new

    LinearAxis


    7

    {


    8

    Orientation

   =

   AxisOrientation.Y,

   //

   指定为Y轴


    9


    Location

   =

   AxisLocation.Right,

   //

   呈现在右侧


   10


    Title

   =


   "

   Range Axis

   "

   ,


   11

    FontSize

   =


   14

   ,


   12


   13


   //

   设置轴的区间


   14


    Minimum

   =


   -

   20

   ,


   15

    Maximum

   =


   20

   ,


   16


   17


   //

   这里使用了两种方法设置颜色


   18


    Background

   =


   new

    SolidColorBrush(Color.FromArgb(

   255

   ,

   255

   ,

   255

   ,

   100

   )),


   19

    Foreground

   =

   new

    SolidColorBrush(Colors.Blue),


   20

    };
模拟数据
     1

     Random random

    =


    new

     Random();


     2


     3

     _dynamicDateItemsSource

    =


    new

     List

    <

    DateTimeValue

    >

    ();


     4


     5


    //

    准备数据


     6


    for

     (

    int

     i

    =


    0

    ; i

    <


    9

    ; i

    ++

    )


     7

     {


     8

     DateTimeValue lv

    =


    new

     DateTimeValue();


     9

     lv.Datetime

    =


    new

     DateTime(

    2008

    ,

    10

    ,

    1

    ,

    13

    ,

    22

    ,

    5

    ).AddHours(i);


    10


    double

     rad

    =

     random.NextDouble();


    11


    if

     (i

    %

    2

    ==

    0

    )


    12

     rad

    =


    -

    1


    *

     rad;


    13


    double

     num

    =

     Math.Round(

    20


    *

     rad,

    2

    );


    14

     lv.Value

    =

     num;


    15

     lv.Data

    =


    new

     List

    <

    PVData

    >

     {


    16


    new

     PVData {


    17

     Local

    =


    "

    Root.AREA5.PV

    "


    +

     i,


    18

     AnalyzerComponent

    =


    "

    52QA007 D-90

    "

    ,


    19

     Description

    =


    "

    DISTLL'N 90% BP

    "

    ,


    20

     Value

    =

    num,


    21

     Quality

    =


    "

    GOOD

    "

    ,


    22

     Unit

    =


    "

    degC

    "

    ,


    23

     EngineeringLow

    =

     i

    *


    4


    +

     i,


    24

     EngineeringHigh

    =

     (i

    +

    1

    )

    *


    3


    -

    i,


    25

     }


    26

     };


    27

     _dynamicDateItemsSource.Add(lv);


    28

     }
lines 4条线分别为 warnLimitUp/Low 和 controlLimitUp/Low
    1

   LineSeries warnLimitUp

   =


    2


   new

    LineSeries


    3

    {


    4

    ItemsSource

   =

    warningLimitUpDate,


    5

    IndependentValueBinding

   =


   new

    Binding(

   "

   Datetime

   "

   ),


    6

    DependentValueBinding

   =


   new

    Binding(

   "

   Value

   "

   ),


    7

    Title

   =


   "

   Warning Limit

   "

   ,


    8

    DataPointStyle

   =

    warningLimitStyle,


    9

    LegendItemStyle

   =

    hideStyle,

   //

   隐藏不需要显示在Legend上的对象


   10


    };


   11


   12

    LineSeries warnLimitLow

   =


   13


   new

    LineSeries


   14

    {


   15

    ItemsSource

   =

    warningLimitLowDate,


   16

    IndependentValueBinding

   =


   new

    Binding(

   "

   Datetime

   "

   ),


   17

    DependentValueBinding

   =


   new

    Binding(

   "

   Value

   "

   ),


   18

    Title

   =


   "

   Warning Limit

   "

   ,


   19

    DataPointStyle

   =

    warningLimitStyle


   20

    };


   21


   22

    LineSeries controlLimitUp

   =


   23


   new

    LineSeries


   24

    {


   25

    ItemsSource

   =

    controlLimitUpDate,


   26

    IndependentValueBinding

   =


   new

    Binding(

   "

   Datetime

   "

   ),


   27

    DependentValueBinding

   =


   new

    Binding(

   "

   Value

   "

   ),


   28

    Title

   =


   "

   Contrl Limit

   "

   ,


   29

    DataPointStyle

   =

    controlLimitStyle,


   30

    LegendItemStyle

   =

    hideStyle


   31

    };


   32


   33

    LineSeries controlLimitLow

   =


   34


   new

    LineSeries


   35

    {


   36

    ItemsSource

   =

    controlLimitLowDate,


   37

    IndependentValueBinding

   =


   new

    Binding(

   "

   Datetime

   "

   ),


   38

    DependentValueBinding

   =


   new

    Binding(

   "

   Value

   "

   ),


   39

    Title

   =


   "

   Contrl Limit

   "

   ,


   40

    DataPointStyle

   =

    controlLimitStyle


   41

    };
对采样点设置样式,以及绑定到第二Y轴
1 ScatterSeries scatterSeries = new ScatterSeries()
2 {
3 ItemsSource = _dynamicDateItemsSource,
4 Title = " Validation Value " ,
5 DataPointStyle = dataPointStyle,
6 IsSelectionEnabled = true ,
7 IndependentValueBinding = new Binding( " Datetime " ),
8 DependentValueBinding = new Binding( " Value " ),
9 DependentRangeAxis = rangeAxis, // 绑定的RangeAxis会自动显示在Chart中
10 };11 //注册采样点被选中时的事件。
12 scatterSeries.SelectionChanged += new SelectionChangedEventHandler(scatterSeries_SelectionChanged);
绑定数据到DataGrid
   1


   void

    scatterSeries_SelectionChanged(

   object

    sender, SelectionChangedEventArgs e)


   2

    {


   3

    DateTimeValue dtv

   =

    e.AddedItems[

   0

   ]

   as

    DateTimeValue;


   4

    dataGrid1.DataContext

   =

    dtv.Data;


   5

    }
下面附上完整代码:
using System;
using System.Collections.Generic;
using System.Windows;
using System.Windows.Controls;
using System.Windows.Media;
using System.Windows.Navigation;
using System.Windows.Controls.DataVisualization.Charting;
using System.Windows.Data;
namespace MySilverlightTest
{
public partial class Control_ChartMultipleAxis : Page
{
public class PVData
{
public string Local
{ get ; set ; }
public string AnalyzerComponent
{ get ; set ; }
public string Description
{ get ; set ; }
public double Value
{ get ; set ; }
public string Quality
{ get ; set ; }
public string Unit
{ get ; set ; }
public int EngineeringLow
{ get ; set ; }
public int EngineeringHigh
{ get ; set ; }
}
public class DateTimeValue
{
public DateTime Datetime
{
get ;
set ;
}
public double Value
{
get ;
set ;
}
public List < PVData > Data
{ get ; set ; }
}
public class LineValue
{
public DateTime Datetime
{ get ; set ; }
public double Value
{ get ; set ; }
}
private List < DateTimeValue > _dynamicDateItemsSource = new List < DateTimeValue > ();
private List < LineValue > warningLimitUpDate = new List < LineValue >
{
new LineValue{ Datetime = new DateTime( 2008 , 10 , 1 , 13 , 22 , 5 ),Value = 4.0 ,},
new LineValue{ Datetime = new DateTime( 2008 , 10 , 1 , 22 , 22 , 5 ),Value = 4.0 },
};
private List < LineValue > warningLimitLowDate = new List < LineValue >
{
new LineValue{ Datetime = new DateTime( 2008 , 10 , 1 , 13 , 22 , 5 ),Value =- 4.0 },
new LineValue{ Datetime = new DateTime( 2008 , 10 , 1 , 22 , 22 , 5 ),Value =- 4.0 },
};
private List < LineValue > controlLimitUpDate = new List < LineValue >
{
new LineValue{ Datetime = new DateTime( 2008 , 10 , 1 , 13 , 22 , 5 ),Value = 6 },
new LineValue{ Datetime = new DateTime( 2008 , 10 , 1 , 22 , 22 , 5 ),Value = 6 },
};
private List < LineValue > controlLimitLowDate = new List < LineValue >
{
new LineValue{ Datetime = new DateTime( 2008 , 10 , 1 , 13 , 22 , 5 ),Value =- 6 },
new LineValue{ Datetime = new DateTime( 2008 , 10 , 1 , 22 , 22 , 5 ),Value =- 6 },
};
public Control_ChartMultipleAxis()
{
InitializeComponent();
Loaded += new RoutedEventHandler(Control_ChartMultipleAxis_Loaded);
}
void Control_ChartMultipleAxis_Loaded( object sender, RoutedEventArgs e)
{
#region Styles
// Chart样式
Style ChartAreaStyle = new System.Windows.Style();
ChartAreaStyle.TargetType = typeof (System.Windows.Controls.Grid);
// 分别对四条线(两种类型)设置样式
Style controlLimitStyle = new System.Windows.Style();
controlLimitStyle.TargetType = typeof (System.Windows.Controls.Control);
Style warningLimitStyle = new System.Windows.Style();
warningLimitStyle.TargetType = typeof (System.Windows.Controls.Control);
// 设置线形图中点的样式
Style dataPointStyle = new System.Windows.Style();
dataPointStyle.TargetType = typeof (System.Windows.Controls.Control);
Style hideStyle = new System.Windows.Style();
hideStyle.TargetType = typeof (System.Windows.Controls.Control);
// 设置时间的显示格式
Style timeStyle = new System.Windows.Style();
timeStyle.TargetType = typeof (System.Windows.Controls.Control);
// 为Style设置Setter
Setter controlLimitsetterTemplate = new Setter(System.Windows.Controls.Control.TemplateProperty, null );
Setter warningLimitsetterTemplate = new Setter(System.Windows.Controls.Control.TemplateProperty, null );
Setter setterBlue = new Setter(System.Windows.Controls.Control.BackgroundProperty, new SolidColorBrush(Colors.Blue));
Setter setterGreen = new Setter(System.Windows.Controls.Control.BackgroundProperty, new SolidColorBrush(Color.FromArgb( 255 , 0 , 255 , 0 )));
Setter setterRed = new Setter(System.Windows.Controls.Control.BackgroundProperty, new SolidColorBrush(Colors.Red));
Setter setterHide = new Setter(System.Windows.Controls.Control.VisibilityProperty, Visibility.Collapsed);
Setter setterArea = new Setter(Grid.BackgroundProperty, new SolidColorBrush(Color.FromArgb( 255 , 255 , 255 , 180 )));
Setter setterTime = new Setter(AxisLabel.StringFormatProperty, " {0:HH:mm} " );
dataPointStyle.Setters.Add(setterBlue);
warningLimitStyle.Setters.Add(warningLimitsetterTemplate);
controlLimitStyle.Setters.Add(controlLimitsetterTemplate);
warningLimitStyle.Setters.Add(setterGreen);
controlLimitStyle.Setters.Add(setterRed);
hideStyle.Setters.Add(setterHide);
ChartAreaStyle.Setters.Add(setterArea);
timeStyle.Setters.Add(setterTime);
#endregion
// 定义X轴
IAxis dateAxis = new DateTimeAxis { Orientation = AxisOrientation.X, Title = " 时间 " , IntervalType = DateTimeIntervalType.Minutes, Interval = 30 , AxisLabelStyle = timeStyle };
// 定义Y轴
IAxis valueAxis = new LinearAxis { Orientation = AxisOrientation.Y, Location = AxisLocation.Left, Title = " Lines " , Minimum = - 10 , Maximum = 10 , ShowGridLines = true };
// 定义需要绑定的轴
IRangeAxis rangeAxis = new LinearAxis
{
Orientation = AxisOrientation.Y, // 指定为Y轴
Location = AxisLocation.Right, // 呈现在右侧
Title = " Range Axis " ,
FontSize = 14 ,
// 设置轴的区间
Minimum = - 20 ,
Maximum = 20 ,
// 这里使用了两种方法设置颜色
Background = new SolidColorBrush(Color.FromArgb( 255 , 255 , 255 , 100 )),
Foreground = new SolidColorBrush(Colors.Blue),
};
Random random = new Random();
_dynamicDateItemsSource = new List < DateTimeValue > ();
// 准备数据
for ( int i = 0 ; i < 9 ; i ++ )
{
DateTimeValue lv = new DateTimeValue();
lv.Datetime = new DateTime( 2008 , 10 , 1 , 13 , 22 , 5 ).AddHours(i);
double rad = random.NextDouble();
if (i % 2 == 0 )
rad = - 1 * rad;
double num = Math.Round( 20 * rad, 2 );
lv.Value = num;
lv.Data = new List < PVData > {
new PVData {
Local = " Root.AREA5.PV " + i,
AnalyzerComponent = " 52QA007 D-90 " ,
Description = " DISTLL'N 90% BP " ,
Value = num,
Quality = " GOOD " ,
Unit = " degC " ,
EngineeringLow = i * 4 + i,
EngineeringHigh = (i + 1 ) * 3 - i,
}
};
_dynamicDateItemsSource.Add(lv);
}
#region lines 4条线分别为 warnLimitUp/Low 和 controlLimitUp/Low
LineSeries warnLimitUp =
new LineSeries
{
ItemsSource = warningLimitUpDate,
IndependentValueBinding = new Binding( " Datetime " ),
DependentValueBinding = new Binding( " Value " ),
Title = " Warning Limit " ,
DataPointStyle = warningLimitStyle,
LegendItemStyle = hideStyle, // 隐藏不需要显示在Legend上的对象
};
LineSeries warnLimitLow =
new LineSeries
{
ItemsSource = warningLimitLowDate,
IndependentValueBinding = new Binding( " Datetime " ),
DependentValueBinding = new Binding( " Value " ),
Title = " Warning Limit " ,
DataPointStyle = warningLimitStyle
};
LineSeries controlLimitUp =
new LineSeries
{
ItemsSource = controlLimitUpDate,
IndependentValueBinding = new Binding( " Datetime " ),
DependentValueBinding = new Binding( " Value " ),
Title = " Contrl Limit " ,
DataPointStyle = controlLimitStyle,
LegendItemStyle = hideStyle
};
LineSeries controlLimitLow =
new LineSeries
{
ItemsSource = controlLimitLowDate,
IndependentValueBinding = new Binding( " Datetime " ),
DependentValueBinding = new Binding( " Value " ),
Title = " Contrl Limit " ,
DataPointStyle = controlLimitStyle
};
#endregion
ScatterSeries scatterSeries = new ScatterSeries()
{
ItemsSource = _dynamicDateItemsSource,
Title = " Validation Value " ,
DataPointStyle = dataPointStyle,
IsSelectionEnabled = true ,
IndependentValueBinding = new Binding( " Datetime " ),
DependentValueBinding = new Binding( " Value " ),
DependentRangeAxis = rangeAxis, // 绑定的RangeAxis会自动显示在Chart中
};
scatterSeries.SelectionChanged += new SelectionChangedEventHandler(scatterSeries_SelectionChanged);
chart.Title = null ;
chart.Series.Add(warnLimitUp);
chart.Series.Add(warnLimitLow);
chart.Series.Add(controlLimitUp);
chart.Series.Add(controlLimitLow);
chart.Series.Add(scatterSeries);
chart.PlotAreaStyle = ChartAreaStyle;
chart.Axes.Add(dateAxis);
chart.Axes.Add(valueAxis);
}
void scatterSeries_SelectionChanged( object sender, SelectionChangedEventArgs e)
{
DateTimeValue dtv = e.AddedItems[ 0 ] as DateTimeValue;
dataGrid1.DataContext = dtv.Data;
}
private void btnExport_Click( object sender, RoutedEventArgs e)
{
ElementToPNG eTP = new ElementToPNG();
eTP.ShowSaveDialog(chart);
}
// Executes when the user navigates to this page.
protected override void OnNavigatedTo(NavigationEventArgs e)
{
}
}
}