发布一个框架的补充文件,引进highcharts等报表控件.
去年,苏嗲有提过HightChart控件.详见highcharts.com,自己一直有关注.最新出的版本是1.2.4,基本稳定下来了.这个网站的人员宣称,在1.5版本时实现3D效果.超期待哦.还等什么,拿过来给我们的前台框架添下光啊.
拿来主义是不错,可是在于嗲的前台上扩展有些困难哦.所幸,经过好几天不懈的努力.总算实现了.
第一个麻烦是基于Ext适配器的实现,因为HightChart组件是基于Jquery或者MooTools框架的,总不能为了一个报表组件引进Jquery或MoolTools吧.以下是部分代码:
window.HighchartsAdapter = {
    getAjax: function (url, callback){
        Ext.Ajax.request({
            url: url,
            success: function (response){
                callback(response.responseText);
            }
        });
    },
    hyphenate: function (str){
        return str.replace(/([A-Z])/g, function (a, b){
            return '-' + b.toLowerCase();
        });
    },
    addEvent: function (el, event, fn){
        var xel = Ext.get(el);
        if (xel) xel.addListener(event, fn);
    },
    fireEvent: function (el, event, eventArguments, defaultFunction){// if fireEvent is not available on the object, there hasn't been added

        if (el.fireEvent) el.fireEvent(event, eventArguments);// fire the default if it is passed and it is not prevented above

        if (defaultFunction) defaultFunction(event);
    },
    animate: function (el, params, options){//jQuery(el).animate(params, options);
        var element = Ext.fly(el);
        var opt = {};
        var duration = 1.5;
        var callback = null;
        for (var p in params){
            opt[p] = {
                to: (params[p] + "").replace("px", "")
            };
        }
        for (var l in options){
            if (l === "complete") callback = options[l];
        }
        element.animate(opt, duration, callback, "easeOut", "run");
    },
    each: function (arr, fn){
        for (var i = 0, len = arr.length; i < len; i++) if (fn.call(arr[i], arr[i], i, arr) === false) return i;
    },
    map: function (arr, fn){
        var results = [];
        if (arr) for (var i = 0, len = arr.length; i < len; i++){
            results[i] = fn.call(arr[i], arr[i], i, arr);
        }
        return results;
    },
    merge: function (){
        var args = arguments;
        return Sail.jqextend(true, null, args[0], args[1], args[2], args[3]);
    },
    grep: function (arr, fn){
        return arr.filter(fn);
    }
};

var merge = window.HighchartsAdapter["merge"];
在于嗲平台上扩展的实现:
Sail.widget.ext.ux_chart = function (config){
    this.title = "myReport";
    this.sub_title;
    this.url;
    this.theme = "grid";
    this.stacking = '';
    this.x_rotation = 0;
    this.y_rotation = 0;
    this.series_root = "dataset.report";
    this.xAxis_root = "dataset.categories";
    this.margin = Highcharts["defaultOptions"]["chart"]["margin"];
    this.legend_layout = '';
    this.xAxis = [];
    this.yAxis = [];//[{name:"",color:"",unit:""}]
    this.series = [];//[{name:"",type:"",data:[]}]
    this.formatter = function (){
        if (this.point && this.point.name && Sail.isEmpty(this.point.name)) return '<b>' + this.point.name + '</b><br/>' + this.y;
        else return '<b>' + this.series.name + '</b><br/>' + this.x + ': ' + this.y;
    };
    Sail.widget.ext.ux_chart.superclass.constructor.call(this, config);
};

Ext.extend(Sail.widget.ext.ux_chart, Sail.widget, {
    defaultHeight: 400,
    defaultWidth: 800,
    defaultSeriesType: "line",
    initComponent: function (){},
    clean_config: function (){
        this.title = "myReport";
        this.sub_title;
        this.url = "";
        this.theme = "grid";
        this.stacking = '';
        this.legend_layout = '';
        this.x_rotation = 0;
        this.y_rotation = 0;
        this.margin = Highcharts["defaultOptions"]["chart"]["margin"];
        this.series_root = "dataset.report";
        this.xAxis_root = "dataset.categories";
        this.xAxis = [];
        this.yAxis = [];//[{name:"",color:"",unit:""}]
        this.series = [];//[{name:"",type:"",data:[]}]
        this.formatter = function (){
            if (this.point && this.point.name && ! Sail.isEmpty(this.point.name)) return '<b>' + this.point.name + '</b><br/>' + this.y;
            else return '<b>' + this.series.name + '</b><br/>' + this.x + ': ' + this.y;
        }
    },
    getHeight: function (){
        return this.height || this.defaultHeight;
    },
    setHeight: function (height){
        this.getOCD().style.height = height || this.getHeight();
    },
    getWidth: function (){
        return this.width || this.defaultWidth;
    },
    setWidth: function (width){
        this.getOCD().style.width = width || this.getWidth();
    },
    getEl: function (){
        return this.el;
    },
    setTheme: function (theme){
        this.theme = theme;
        Highcharts.setOptions(_THEMES[this.theme]);
    },
    getTheme: function (){
        return this.theme;
    },
    init_config: function (config){
        if ( ! Sail.isEmpty(config)) Ext.apply(this, config);
        this.options = {};
        Highcharts.setOptions(_THEMES[this.theme]);
        this.options = {
            chart: {
                renderTo: this.getOCD(),
                margin: this.margin,
                defaultSeriesType: this.defaultSeriesType
            },
            credits: {
                enabled: true,
                href: "http://www.talkweb.com.cn",
                target: "_self",
                text: "talkweb.com.cn"
            },
            title: {
                text: this.title
            },
            subtitle: {
                text: this.sub_title
            },
            xAxis: [{
                categories: this.xAxis,
                labels: {
                    rotation: this.x_rotation || 0,
                    align: 'center',
                    style: {
                        font: 'normal 13px Verdana, sans-serif'
                    }
                }
            }],
            yAxis: ! Sail.isEmpty(this.yAxis) ? this.yAxis : {
                title: {
                    enabled: false,
                    text: ""
                }
            },
            tooltip: {
                enabled: true,
                formatter: this.formatter
            },
            legend: {
                layout: 'vertical',
                style: {
                    left: '120px',
                    bottom: 'auto',
                    right: 'auto',
                    top: '100px'
                },
                backgroundColor: '#FFFFFF'
            },
            plotOptions: {
                column: {
                    dataLabels: {
                        rotation: this.y_rotation || 0,
                        enabled: this.y_rotation !== 0,
                        color: '#FFFFFF',
                        align: "right"
                    },
                    stacking: Sail.isEmpty(this.stacking) ? '' : "normal"
                },
                area: {
                    stacking: 'percent',
                    lineColor: '#ffffff',
                    lineWidth: 1,
                    marker: {
                        lineWidth: 1,
                        lineColor: '#ffffff'
                    }
                }
            },
            series: this.series
        };
        if (Sail.isEmpty(this.legend_layout)) this.options.legend = Highcharts["defaultOptions"]["legend"];
        if (Sail.isArray(this.yAxis) && ! Sail.isEmpty(this.yAxis)){
            var units_rs = {};
            this.options.yAxis = [];
            Ext.each(this.yAxis, function (el, i, s){
                this.options.yAxis.push({
                    title: {
                        text: el.name,
                        margin: i > 0 ? 70 * i : 70,
                        style: {
                            color: el.color
                        }
                    },
                    labels: {
                        formatter: function (){
                            return this.value + el.unit || "";
                        },
                        style: {
                            color: el.color
                        }
                    },
                    opposite: i > 0 ? true : false
                });
                units_rs[el.name] = el.unit || "";
            }, this);
            this.options.tooltip["formatter"] = function (){
                return '<b>' + this.series.name + '</b><br/>' + this.x + ': ' + this.y + units_rs[this.series.name];
            };
        }
        if (this.url){
            var self = this;
            Sail.postData(this.url, {}, function (flag, rs){
                if (flag){
                    self.xAxis = Sail.splat(Sail.getSubObj(rs, self.xAxis_root));
                    self.series = Sail.splat(Sail.getSubObj(rs, self.series_root));
                    self.options.xAxis[0]["categories"] = self.xAxis;
                    self.options.series = self.series;
                    self.el = new Highcharts.Chart(self.options);
                }
            });
        }
        else this.el = new Highcharts.Chart(this.options);
    },
    load: function (config){
        if (this.el) this.el.destroy();
        var this_obj = this;
        (function (){
            this_obj.clean_config();
        }).createSequence(function (){
            this.init_config(config);
        }, this)();
    },
    createWidgetElement: function (){
        this.init_config();
    }
});
以下是使用示例:
改变数据源
示例如图:
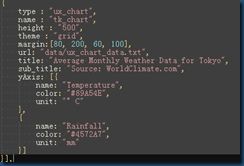
配置参数说明,hightchart组件的配置参数非常麻烦.在于嗲平台上扩展后,虽然简化了配置.但要配合一定的后台数据结构.这个还可以再修正.
以下作又部分参数作一个简短的说明.
type : "ux_chart" 报表的组合类型,值固定.
name : 报表名称,方便之后引用.
title :报表标题.
sub_title :报表副标题.
url:请求数据地址.
theme:报表皮肤.有dark-blue,dark-green,grid,default,gray,minimal.默认为grid,个人觉得这个最好看.
series_root:Y轴后台数据结构名称定制.默认为"dataset.report".
xAxis_root:X轴后台数据结构名称定制.默认为"dataset.categories".
yAxis:Y轴坐标轴定制,可以定义多个,详见示例.
legend_layout:定义图例的布局.horizontal or vertical.
x_rotation:x轴旋转角度,默认值0
y_rotation:y轴旋转角度,默认值0
margin:报表边辐.有默认值
svn地址 http://svn.talkweb.com.cn/svn/TBpl/MES产品化项目/01_工作区/04_编码/GUIF
示例文件名称 : ux_chart_1.html ,注意文件的引用.如图:
总结一下:
发布了一个ms_util.js文件,视需要可以作为对框架文件的必要补充.框架的文件未变动,所以对所有项目是兼容的.
这个文件主要是提供了hightchart报表控件的扩展,引进了hightchart库.
提供了一个遍历表单组件的方法.非常灵活哦.
简化了combox组件的配置,提供一个简单的赋值方法.
为sDate组件提供了set_current_date方法以设置默认值.
修正了框架一些不太好的地方.
重点说明一下:框架已经提供了报表的实现,虽然简单.但满足了作为报表的所有功能.并且在许多项目中有应用.这个是于嗲的原创,想学习js实现报表的话,不妨将这部分好好研究一下.另外,于嗲的框架平台的扩展性还是很强的,再赞一个.


