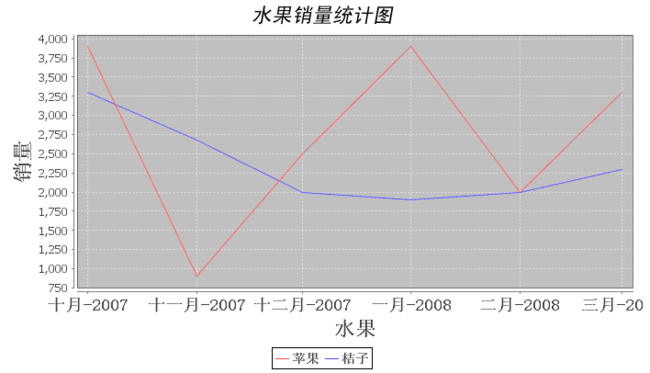
上效果图:

当然可以将数据导出图片格式存储。具体下的链接里的文件有保存成图片的操作。
因为是strust2整合JFreechart,所以strust2框架一定得搭建好。
1.导入三个包:http://download.csdn.net/detail/x46466/4328100
jcommon-1.0.16.jar
jfreechart-1.0.13.jar
struts2-jfreechart-plugin-2.0.11.jar
2.修改web.xml
<!-- Struts2的过滤器 -->
<filter>
<filter-name>struts2</filter-name>
<filter-class>org.apache.struts2.dispatcher.FilterDispatcher</filter-class>
</filter>
<filter-mapping>
<filter-name>struts2</filter-name>
<url-pattern>/*</url-pattern>
</filter-mapping>
修改成:
<filter>
<filter-name>struts-prepare</filter-name>
<filter-class>org.apache.struts2.dispatcher.ng.filter.StrutsPrepareFilter</filter-class>
</filter>
<filter>
<filter-name>struts-execute</filter-name>
<filter-class>org.apache.struts2.dispatcher.ng.filter.StrutsExecuteFilter</filter-class>
</filter>
<filter-mapping>
<filter-name>struts-prepare</filter-name>
<url-pattern>/*</url-pattern>
</filter-mapping>
<filter-mapping>
<filter-name>struts-execute</filter-name>
<url-pattern>/*</url-pattern>
</filter-mapping>
3.写action
1)3D饼图
/**
* @author zhengxinzao
*
*/
public class PieChart3DAction extends ActionSupport {
private JFreeChart chart;
public JFreeChart getChart() {
chart = ChartFactory.createPieChart3D("学生成绩分析", getDataset(), true,
false, false);
chart
.setTitle(new TextTitle("学生成绩分析", new Font("黑体", Font.ITALIC,
22)));
LegendTitle legend = chart.getLegend();
legend.setItemFont(new Font("宋体", Font.ITALIC, 14));
PiePlot3D plot = (PiePlot3D) chart.getPlot();
plot.setLabelFont(new Font("隶书", Font.ITALIC, 18));
// 设定背景透明度(0-1.0之间)
plot.setBackgroundAlpha(0.9f);
// 设定前景透明度(0-1.0之间)
plot.setForegroundAlpha(0.50f);
String unitStyle = "{0}={1}({2})";
// 设置图例显示样式
plot.setLabelGenerator(new StandardPieSectionLabelGenerator(unitStyle,
NumberFormat.getNumberInstance(), new DecimalFormat("0.00%")));
// 设置引用标签显示样式
plot.setLegendLabelGenerator(new StandardPieSectionLabelGenerator(
unitStyle, NumberFormat.getNumberInstance(), new DecimalFormat(
"0.00%")));
return chart;
}
public void setChart(JFreeChart chart) {
this.chart = chart;
}
private DefaultPieDataset getDataset() {
DefaultPieDataset dataset = new DefaultPieDataset();
dataset.setValue("不及格", 2);
dataset.setValue("及格", 8);
dataset.setValue("中等", 15);
dataset.setValue("良好", 15);
dataset.setValue("优秀", 5);
dataset.setValue("优秀1", 5);
return dataset;
}
}
2)拆线图
/**
* @author zhengxinzao
*
*/
public class LineChartAction extends ActionSupport {
private JFreeChart chart;
public JFreeChart getChart() {
chart = ChartFactory.createTimeSeriesChart("水果销量统计图", "水果", "销量",
getDataSet(), true, false, false);
// 重新设置图标标题,改变字体
chart
.setTitle(new TextTitle("水果销量统计图", new Font("黑体", Font.ITALIC,
22)));
// 取得统计图标的第一个图例
LegendTitle legend = chart.getLegend(0);
// 修改图例的字体
legend.setItemFont(new Font("宋体", Font.BOLD, 14));
XYPlot plot = (XYPlot) chart.getPlot();
// 取得横轴
ValueAxis categoryAxis = plot.getDomainAxis();
// 设置横轴显示标签的字体
categoryAxis.setLabelFont(new Font("宋体", Font.BOLD, 22));
categoryAxis.setTickLabelFont(new Font("宋体", Font.BOLD, 18));
// 取得纵轴
NumberAxis numberAxis = (NumberAxis) plot.getRangeAxis();
// 设置纵轴显示标签的字体
numberAxis.setLabelFont(new Font("宋体", Font.BOLD, 22));
return chart;
}
public void setChart(JFreeChart chart) {
this.chart = chart;
}
// 返回一个CategoryDataset实例
private static XYDataset getDataSet() {
TimeSeries apple = new TimeSeries("苹果", Month.class);
apple.add(new Month(10, 2007), 3900);
apple.add(new Month(11, 2007), 900);
apple.add(new Month(12, 2007), 2500);
apple.add(new Month(1, 2008), 3900);
apple.add(new Month(2, 2008), 2000);
apple.add(new Month(3, 2008), 3300);
TimeSeries orange = new TimeSeries("桔子", Month.class);
orange.add(new Month(10, 2007), 3300);
orange.add(new Month(11, 2007), 2680);
orange.add(new Month(12, 2007), 2000);
orange.add(new Month(1, 2008), 1900);
orange.add(new Month(2, 2008), 2000);
orange.add(new Month(3, 2008), 2300);
TimeSeriesCollection dataset = new TimeSeriesCollection();
dataset.addSeries(apple);
dataset.addSeries(orange);
return dataset;
}
}
3)柱形图
/**
* @author zhengxinzao
*
*/
public class BarChart3DAction extends ActionSupport {
private JFreeChart chart;
public JFreeChart getChart() {
chart = ChartFactory.createBarChart3D("学生成绩分析", "成绩", "人数",
getDataset(), PlotOrientation.VERTICAL, true, false, false);
chart
.setTitle(new TextTitle("学生成绩分析", new Font("黑体", Font.ITALIC,
22)));
LegendTitle legend = chart.getLegend();
// 修改图例的字体
legend.setItemFont(new Font("宋体", Font.ITALIC, 14));
CategoryPlot plot = (CategoryPlot) chart.getPlot();
// 取得横轴
CategoryAxis categoryAxis = plot.getDomainAxis();
categoryAxis.setLabelFont(new Font("宋体", Font.BOLD, 22));
// 分类标签以45度角倾斜
categoryAxis.setCategoryLabelPositions(CategoryLabelPositions.UP_45);
categoryAxis.setTickLabelFont(new Font("宋体", Font.BOLD, 22));
// 取得纵轴
NumberAxis numberAxis = (NumberAxis) plot.getRangeAxis();
numberAxis.setLabelFont(new Font("宋体", Font.BOLD, 22));
return chart;
}
/**
* @return
*/
private CategoryDataset getDataset() {
DefaultCategoryDataset dataset = new DefaultCategoryDataset();
dataset.addValue(2, "1班", "不及格");
dataset.addValue(4, "2班", "不及格");
dataset.addValue(5, "3班", "不及格");
dataset.addValue(8, "1班", "及格");
dataset.addValue(5, "2班", "及格");
dataset.addValue(10, "3班", "及格");
dataset.addValue(15, "1班", "中等");
dataset.addValue(10, "2班", "中等");
dataset.addValue(10, "3班", "中等");
dataset.addValue(15, "1班", "良好");
dataset.addValue(15, "2班", "良好");
dataset.addValue(15, "3班", "良好");
dataset.addValue(5, "1班", "优秀");
dataset.addValue(5, "2班", "优秀");
dataset.addValue(5, "3班", "优秀");
return dataset;
}
public void setChart(JFreeChart chart) {
this.chart = chart;
}
}
4.加入strust.xml:
<package name="jfreechar" namespace="/jfreechar" extends="jfreechart-default">
<action name="pieChart3DAction" class="com.zxz.ssh.JFreeChart.PieChart3DAction">
<result type="chart">
<param name="width">700</param>
<param name="height">400</param>
</result>
</action>
<action name="lineChartAction" class="com.zxz.ssh.JFreeChart.LineChartAction">
<result type="chart">
<param name="width">700</param>
<param name="height">400</param>
</result>
</action>
<action name="barChart3DAction" class="com.zxz.ssh.JFreeChart.BarChart3DAction">
<result type="chart">
<param name="width">700</param>
<param name="height">400</param>
</result>
</action>
</package>
5.jsp中使用:
<img alt="" src="jfreechar/pieChart3DAction" style="margin: auto;">
<br />
<img alt="" src="jfreechar/lineChartAction" style="margin: auto;">
<br />
<img alt="" src="jfreechar/barChart3DAction" style="margin: auto;">
<br />

