在用highchart 的时候遇到了问题:
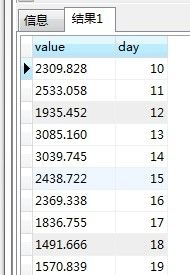
下图是数据库查询的结果,需展现在 页面上,value对应Y轴,day(日期)对应X轴
可是我用json获取数据展示的时候,出问题了,如下图,就是X轴显示成了数据库查询出来的列名(即0,1,0,1,0...),而并没有显示的是day(日期),它显示到了Y轴上去了,如何解决?
	  var xset = [];//X轴数据集

	  var yset = [];//Y轴数据集
function getData(){
		$.getJSON("${pageContext.request.contextPath}/month!getMonthList.action",function(data){
			$.each(data,function(i,item){
				  $.each(item,function(k,v){
                     xset.push(k);
                     yset.push(v);
                 });
			});
            showChart(xset,yset);
		});
	}
chart代码
function showChart(xset,yset){
	$('#container')
	.highcharts(
			{
				 credits: {
		                enabled: false     //去掉highcharts网站url
		            }  ,
				chart : {
					type : 'column',
					margin : [ 50, 50, 50, 50 ]
				},
				title : {
					text : 'this is a test'
				},
				xAxis : {
					categories : xset,
				/* 	labels : {
						/* rotation: -0,
						align: 'right',
						style : {
							fontSize : '13px',
							fontFamily : 'Verdana, sans-serif'
						}
					} */
				},
				yAxis : {
					min : 0,
					title : {
						text : 'value(SVG)'
					}
				},
				legend : {
					enabled : false
				},
				tooltip : {
					pointFormat : 'value: <b>{point.y:.1f} SVG</b>',
				},
				series : [ {
					name : 'Population',
					data : yset,
					dataLabels : {
						enabled : true,
						rotation : -0,
						color : 'black',
						//align: 'right',
						//x : 4,
						//y : 10,
						style : {
							fontSize : '13px',
							fontFamily : 'Verdana, sans-serif',
							textShadow : '0 0 3px black'
						}
					}
				} ]
			});
	}

	getData();
各位帮忙看一下,

