R与t分布(2) 累积分布函数
t分布的累积分布函数为:
其中其中: 是超几何函数
结果如下:
其中其中: 是超几何函数
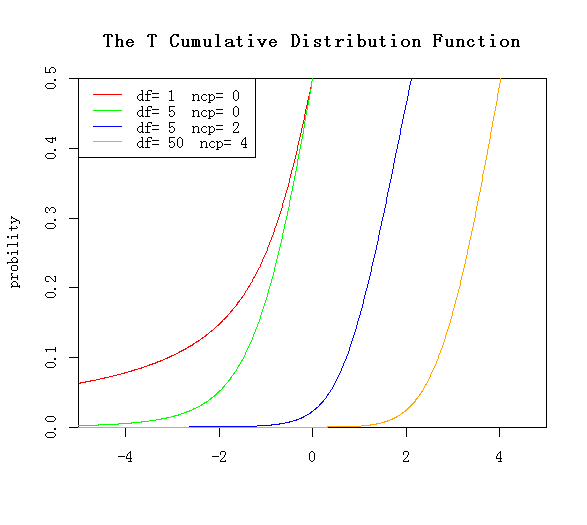
set.seed(1000)
x<-seq(-5,5,length.out=1000)
y<-pt(x,1,0)

plot(x,y,col="red",xlim=c(-5,5),ylim=c(0,0.5),type='l',
     xaxs="i", yaxs="i",ylab='probility',xlab='',
     main="The T Cumulative Distribution Function")

lines(x,pt(x,5,0),col="green")
lines(x,pt(x,5,2),col="blue")
lines(x,pt(x,50,4),col="orange")

legend("topleft",legend=paste("df=",c(1,5,5,50)," ncp=", c(0,0,2,4)), lwd=1, col=c("red", "green","blue","orange"))
结果如下: