s2008下免费图表控件
1. 前言
Microsoft Chart Controls 是微軟提供,適用於 .NET Framework 3.5 SP1 的 ASP.NET 和 Windows Form 圖表控制項,由於已經有蠻多文章介紹在 ASP.NET 與 Windows Forms 使用 Microsoft Chart Controls,而本文想要來點不一樣的,讓大家知道 Microsoft Chart Controls 也可以在 WPF 使用。
2. 前置作業
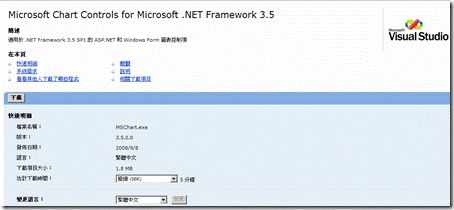
想要使用 Microsoft Chart Controls,首先當然必須上微軟網站下載與安裝,而關於 Microsoft Chart Controls 會有一些相關的下載
Microsoft Chart Controls for Microsoft .NET Framework 3.5 : Microsoft Chart Controls 主要的安裝程式
Microsoft Chart Controls for Microsoft .NET Framework 3.5 語言套件 : Microsoft Chart Controls 的相關訊息文字,例如錯誤訊息,目前提供 23 種語言,其中包含繁體中文

Microsoft Chart Controls Add-on for Microsoft Visual Studio 2008 : 提供 Microsoft Chart Controls 與 Visual Studio 2008 工具箱整合,以及 Microsoft Chart Controls 的 IntelliSense

3. 使用 Microsoft Chart Controls
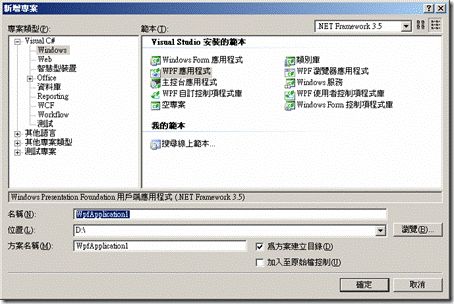
首先,新增 WPF 應用程式
3.1 加入所需 DLL
將所需的 DLL 加入參考中,有以下三個
C:\Program Files\Reference Assemblies\Microsoft\Framework\v3.0\WindowsFormsIntegration.dll : Windows Presentation Foundation WindowsForms Integration Library

C:\Program Files\Microsoft Chart Controls\Assemblies\System.Windows.Forms.DataVisualization.dll : Microsoft Chart Controls DLL

System.Windows.Forms.dll

將參考的DLL加到 namespace 中
 xmlns:wfi="clr-namespace:System.Windows.Forms.Integration;assembly=WindowsFormsIntegration"
 xmlns:wf="clr-namespace:System.Windows.Forms;assembly=System.Windows.Forms"
 xmlns:CHR="clr-namespace:System.Windows.Forms.DataVisualization.Charting;assembly=System.Windows.Forms.DataVisualization"
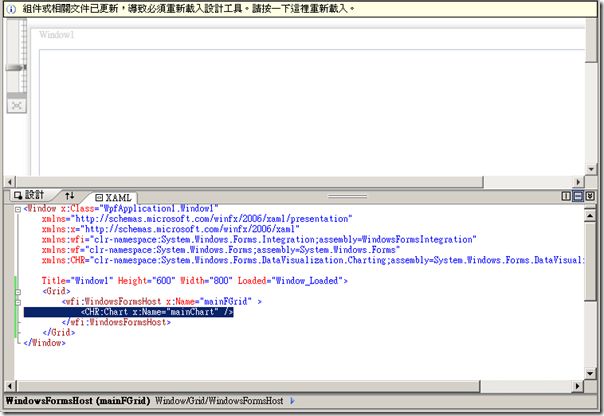
3.2 撰寫 XAML,將 Microsoft Chart Contorls 加入
加入 WindowsFormHost 控制項,原因是 WPF 並沒有辦法直接執行 Windows Forms 的控制項,Forms integration dll 與 WindowsFormHost 可以幫助我們達成。
<Grid>
      <wfi:WindowsFormsHost x:Name="mainFGrid" >

      </wfi:WindowsFormsHost>
 </Grid>

在 WindowsFormHost 控制項中加入 Microsoft Chart Controls,就可以開始使用了
<wfi:WindowsFormsHost x:Name="mainFGrid" >
            <CHR:Chart x:Name="mainChart" />
        </wfi:WindowsFormsHost>
3.3 後端程式碼
這部份先參考 Jeff 的文章 MSChart的基本運用介紹,做出Performance Counter的介面 ,裡面有相當棒的範例,在此繪製 CPU 曲線於 Microsoft Chart Controls,每秒更新一次(http://www.my400800.cn )。
 using System;
 using System.Collections.Generic;
 using System.Linq;
 using System.Text;
 using System.Windows;
 using System.Windows.Controls;
 using System.Windows.Data;
 using System.Windows.Documents;
 using System.Windows.Input;
 using System.Windows.Media;
 using System.Windows.Media.Imaging;
 using System.Windows.Navigation;
 using System.Windows.Shapes;

 using System.Data;
 using System.Windows.Threading;
 using System.Diagnostics;
 using System.Windows.Forms.DataVisualization.Charting;

 namespace WpfApplication1
 {
     /// <summary>
     /// Window1.xaml 的互動邏輯
     /// </summary>
     public partial class Window1 : Window
      {
         public Window1()
          {
              InitializeComponent();
          }

          DataTable dt = new DataTable();

         private void Window_Loaded(object sender, RoutedEventArgs e)
          {
              DispatcherTimer dispatcherTimer = new DispatcherTimer();
              dispatcherTimer.Tick += new EventHandler(dispatcherTimer_Tick);
              dispatcherTimer.Interval = new TimeSpan(0, 0, 1);
              dispatcherTimer.Start();

             //設定DataTable的欄位
              SetDataTable();
             //設定Chart Control
              SetChart();

             this.mainChart.DataSource = dt;
             this.mainChart.DataBind();//這時候先DataBind()是為了顯示空白的圖表
          }

         /// <summary>
         /// 設定DataTable的欄位
         /// </summary>
         private void SetDataTable()
          {
              dt.Columns.Add("Processor");
              dt.Columns.Add("Memory");

             //這個動作只是為了能夠在一開始顯示圖表,比例就是30筆
             for (int i = 0; i < 30; i++)
              {
                  DataRow dr = dt.NewRow();
                  dr["Processor"] = 0;
                  dt.Rows.Add(dr);
              }
          }

         /// <summary>
         /// 設定Chart Control
         /// </summary>
         private void SetChart()
          {
              ChartArea ca = new ChartArea("ChartArea1");
              ca.Area3DStyle.Enable3D = true;//開啟3D
             this.mainChart.ChartAreas.Add(ca);

             //Processor
              Legend lgCPU = new Legend("Legend1");
              lgCPU.IsTextAutoFit = true;
              lgCPU.Docking = Docking.Bottom;
             this.mainChart.Legends.Add(lgCPU);

              Series seCPU = new Series("SeriesCPU");
              seCPU.ChartArea = "ChartArea1";
              seCPU.ChartType = System.Windows.Forms.DataVisualization.Charting.SeriesChartType.Line;
              seCPU.IsVisibleInLegend = true;
              seCPU.Legend = "Legend1";
              seCPU.LegendText = "CPU";
              seCPU.YValueMembers = "Processor";
             this.mainChart.Series.Add(seCPU);
          }

          PerformanceCounter pcCPU = new PerformanceCounter("Processor", "% Processor Time", "_Total", true);

         //   System.Windows.Threading.DispatcherTimer.Tick handler
         //
         //   Updates the current seconds display and calls
         //   InvalidateRequerySuggested on the CommandManager to force
         //   the Command to raise the CanExecuteChanged event.
         private void dispatcherTimer_Tick(object sender, EventArgs e)
          {
             if (dt.Rows.Count > 30)//這動作只是保留顯示30筆即可,不用一直再增加下去
              {
                  dt.Rows.RemoveAt(0);
              }
              DataRow dr = dt.NewRow();

              dr["Processor"] = pcCPU.NextValue();//比例1:1

              dt.Rows.Add(dr);
             //因為DataSource在Form Load就設了,所以這裡只要重新DataBind()就可以更新顯示資料,沒重DataBind之前,新資料不會顯示上去
             this.mainChart.DataBind();

             // Forcing the CommandManager to raise the RequerySuggested event
              CommandManager.InvalidateRequerySuggested();
          }
      }
 }
using System;
using System.Collections.Generic;
using System.Linq;
using System.Text;
using System.Windows;
using System.Windows.Controls;
using System.Windows.Data;
using System.Windows.Documents;
using System.Windows.Input;
using System.Windows.Media;
using System.Windows.Media.Imaging;
using System.Windows.Navigation;
using System.Windows.Shapes;

using System.Data;
using System.Windows.Threading;
using System.Diagnostics;
using System.Windows.Forms.DataVisualization.Charting;

namespace WpfApplication1
{
    /// <summary>
    /// Window1.xaml 的互動邏輯
    /// </summary>
    public partial class Window1 : Window
    {
        public Window1()
        {
            InitializeComponent();
        }

        DataTable dt = new DataTable();

        private void Window_Loaded(object sender, RoutedEventArgs e)
        {
            DispatcherTimer dispatcherTimer = new DispatcherTimer();
            dispatcherTimer.Tick += new EventHandler(dispatcherTimer_Tick);
            dispatcherTimer.Interval = new TimeSpan(0, 0, 1);
            dispatcherTimer.Start();

            //設定DataTable的欄位
            SetDataTable();
            //設定Chart Control
            SetChart();

            this.mainChart.DataSource = dt;
            this.mainChart.DataBind();//這時候先DataBind()是為了顯示空白的圖表
        }

        /// <summary>
        /// 設定DataTable的欄位
        /// </summary>
        private void SetDataTable()
        {
            dt.Columns.Add("Processor");
            dt.Columns.Add("Memory");

            //這個動作只是為了能夠在一開始顯示圖表,比例就是30筆
            for (int i = 0; i < 30; i++)
            {
                DataRow dr = dt.NewRow();
                dr["Processor"] = 0;
                dt.Rows.Add(dr);
            }
        }

        /// <summary>
        /// 設定Chart Control
        /// </summary>
        private void SetChart()
        {
            ChartArea ca = new ChartArea("ChartArea1");
            ca.Area3DStyle.Enable3D = true;//開啟3D
            this.mainChart.ChartAreas.Add(ca);

            //Processor
            Legend lgCPU = new Legend("Legend1");
            lgCPU.IsTextAutoFit = true;
            lgCPU.Docking = Docking.Bottom;
            this.mainChart.Legends.Add(lgCPU);

            Series seCPU = new Series("SeriesCPU");
            seCPU.ChartArea = "ChartArea1";
            seCPU.ChartType = System.Windows.Forms.DataVisualization.Charting.SeriesChartType.Line;
            seCPU.IsVisibleInLegend = true;
            seCPU.Legend = "Legend1";
            seCPU.LegendText = "CPU";
            seCPU.YValueMembers = "Processor";
            this.mainChart.Series.Add(seCPU);
        }

        PerformanceCounter pcCPU = new PerformanceCounter("Processor", "% Processor Time", "_Total", true);

        //  System.Windows.Threading.DispatcherTimer.Tick handler
        //
        //  Updates the current seconds display and calls
        //  InvalidateRequerySuggested on the CommandManager to force
        //  the Command to raise the CanExecuteChanged event.
        private void dispatcherTimer_Tick(object sender, EventArgs e)
        {
            if (dt.Rows.Count > 30)//這動作只是保留顯示30筆即可,不用一直再增加下去
            {
                dt.Rows.RemoveAt(0);
            }
            DataRow dr = dt.NewRow();

            dr["Processor"] = pcCPU.NextValue();//比例1:1

            dt.Rows.Add(dr);
            //因為DataSource在Form Load就設了,所以這裡只要重新DataBind()就可以更新顯示資料,沒重DataBind之前,新資料不會顯示上去
            this.mainChart.DataBind();

            // Forcing the CommandManager to raise the RequerySuggested event
            CommandManager.InvalidateRequerySuggested();
        }
    }
}
程式碼下載
[ChartControl]在 WPF 使用 Microsoft Chart Controls.rar
4. 執行結果
5. 參考
DOT.Developer Microsoft Chart Controls in a WPF application!