package com.xlk.jfreechart;

import java.awt.Color;
import java.awt.Font;
import java.io.File;
import java.io.IOException;

import org.jfree.chart.ChartFactory;
import org.jfree.chart.ChartUtilities;
import org.jfree.chart.JFreeChart;
import org.jfree.chart.axis.AxisLocation;
import org.jfree.chart.axis.NumberAxis;
import org.jfree.chart.labels.StandardCategorySeriesLabelGenerator;
import org.jfree.chart.plot.CategoryPlot;
import org.jfree.chart.plot.PlotOrientation;
import org.jfree.chart.renderer.category.BarRenderer;
import org.jfree.data.category.CategoryDataset;
import org.jfree.data.category.DefaultCategoryDataset;
import org.jfree.data.general.DatasetUtilities;
import org.junit.Test;
/**
 * 对bar的一些操作
 * @author star
 *
 */
public class BarChartDemo {
private static final Font font = new Font("宋体", Font.BOLD, 20);
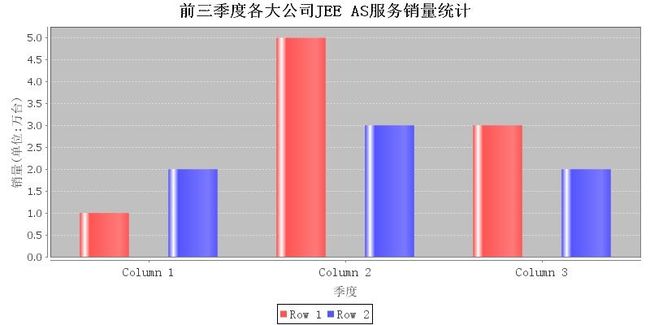
private static CategoryDataset createDataset() {
DefaultCategoryDataset dataset = new DefaultCategoryDataset();
dataset.addValue(1.0, "Row 1", "Column 1");
dataset.addValue(5.0, "Row 1", "Column 2");
dataset.addValue(3.0, "Row 1", "Column 3");
dataset.addValue(2.0, "Row 2", "Column 1");
dataset.addValue(3.0, "Row 2", "Column 2");
dataset.addValue(2.0, "Row 2", "Column 3");
return dataset;
}
/**
*
*@time: 2013-5-7
*@author: star
* @Title: createBar2DChart
* @Description: TODO(创建普通垂直条形图)
* @return JFreeChart    返回类型
* @throws
*/
public static JFreeChart createBar2DChart(CategoryDataset dataset){
String title1 = "前三季度各大公司JEE AS服务销量统计" ;
String title2 = "季度" ;
String title3 = "销量(单位:万台)" ;
JFreeChart chart = ChartFactory.createBarChart(title1, title2, title3, dataset, PlotOrientation.VERTICAL, true, true, false);
//标题字体
chart.getTitle().setFont(font);
//提示条字体
chart.getLegend().setItemFont(new Font("宋体",Font.PLAIN,15));
CategoryPlot plot = (CategoryPlot) chart.getPlot();
//域轴字体(横轴)
plot.getDomainAxis().setLabelFont(new Font("宋体",Font.PLAIN,15));
plot.getDomainAxis().setTickLabelFont(new Font("宋体",Font.PLAIN,15));
//范围轴字体
plot.getRangeAxis().setLabelFont(new Font("宋体",Font.PLAIN,15));
/**
* 调用 JFreeChart 和 CategoryPlot 类方法可以进行一些简单的直方图表外观的修改。
例如,改变图表和区域的背景颜色代码如下:
*/
chart.setBackgroundPaint(Color.white);
plot.setBackgroundPaint(Color.lightGray);
plot.setRangeGridlinePaint(Color.white);
/**
* 改变图表中每个系列直方图的颜色,使用如下代码:
*
*/
BarRenderer renderer = (BarRenderer) plot.getRenderer();
renderer.setSeriesPaint(0, Color.gray);
renderer.setSeriesPaint(1, Color.orange);
renderer.setDrawBarOutline(false);
/**
* 此外,renderer 还可以控制每个种类中直方条形图之间的间距。因此我们可以在
同一个种类中将空间完全去掉,代码如下:
*/

renderer.setItemMargin(0.0);
return chart;
}
@Test
public void createBar2DChartTest(){
CategoryDataset dataset = createDataset();
JFreeChart chart = createBar2DChart(dataset);
try {
ChartUtilities.saveChartAsJPEG(new File("E:/temp/bar2D01.jpg"), chart, 800, 400);
} catch (IOException e) {
System.out.println("生成图片错误");
e.printStackTrace();
}
}

/**
*
*@time: 2013-5-7
*@author: star
* @Title: createBar2DChart2
* @Description: TODO(创建水平条形图)
* @return JFreeChart    返回类型
* @throws
*/
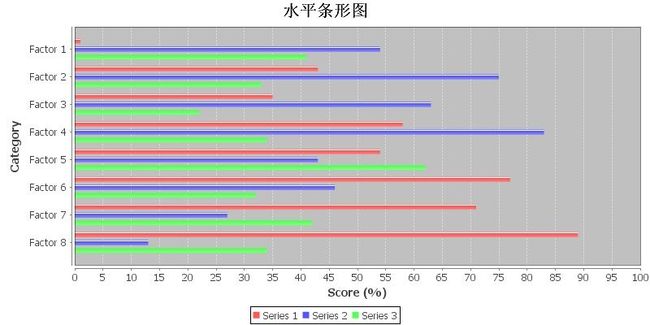
public static JFreeChart createBar2DChart2(CategoryDataset dataset){
JFreeChart jfreechart = ChartFactory.createBarChart("水平条形图", "Category", "Score (%)", dataset,PlotOrientation.HORIZONTAL, true, true, false);
jfreechart.getTitle().setFont(font);
jfreechart.setBackgroundPaint(Color.white);
CategoryPlot categoryplot = (CategoryPlot) jfreechart.getPlot();
categoryplot.setBackgroundPaint(Color.lightGray);
categoryplot.setRangeGridlinePaint(Color.white);
categoryplot.setRangeAxisLocation(AxisLocation.BOTTOM_OR_LEFT);
NumberAxis numberaxis = (NumberAxis) categoryplot.getRangeAxis();
numberaxis.setRange(0.0, 100.0);
numberaxis.setStandardTickUnits(NumberAxis.createIntegerTickUnits());
BarRenderer barrenderer = (BarRenderer) categoryplot.getRenderer();
barrenderer.setDrawBarOutline(false);
barrenderer.setLegendItemToolTipGenerator(new StandardCategorySeriesLabelGenerator("Tooltip: {0}"));
return jfreechart;
}
/**
*
*@time: 2013-5-7
*@author: star
* @Title: createDataset2
* @Description: TODO(数据集另一种创建方式,使用二维数组)
* @return CategoryDataset    返回类型
* @throws
*/
private static CategoryDataset createDataset2() {
double[][] ds = { { 1.0, 43.0, 35.0, 58.0, 54.0, 77.0, 71.0, 89.0 },
{ 54.0, 75.0, 63.0, 83.0, 43.0, 46.0, 27.0, 13.0 },
{ 41.0, 33.0, 22.0, 34.0, 62.0, 32.0, 42.0, 34.0 } };
return DatasetUtilities.createCategoryDataset("Series ", "Factor ", ds);
}
@Test
public void createBar2DChart2Test(){
CategoryDataset dataset = createDataset2();
JFreeChart chart = createBar2DChart2(dataset);
try {
ChartUtilities.saveChartAsJPEG(new File("E:/temp/bar2D02.jpg"), chart, 800, 400);
} catch (IOException e) {
System.out.println("生成图片错误");
e.printStackTrace();
}
}

}


