Handing Memory leaks in Java Program
原文地址:
http://www.ibm.com/developerworks/library/j-leaks/
Handling memory leaks in Java programsFind out when memory leaks are a concern and how to prevent them
Jim Patrick ([email protected]), Advisory Programmer, IBM Pervasive Computing
Jim Patrick is an Advisory Programmer in IBM's Pervasive Computing Division. He has been programming in Java since 1996. Contact Jim at [email protected].
Summary: Memory leaks in Java programs? Absolutely. Contrary to popular belief, memory management is still a consideration in Java programming. In this article, you'll learn what causes Java memory leaks and when these leaks should be of concern. You'll also get a quick hands-on lesson for tackling leaks in your own projects.
How memory leaks manifest themselves in Java programs
Most programmers know that one of the beauties of using a programming language such as Java is that they no longer have to worry about allocating and freeing memory. You simply create objects, and Java takes care of removing them when they are no longer needed by the application through a mechanism known as garbage collection. This process means that Java has solved one of the nasty problems that plague other programming languages -- the dreaded memory leak. Or has it?
Before we get too deep into our discussion, let's begin by reviewing how garbage collection actually works. The job of the garbage collector is to find objects that are no longer needed by an application and to remove them when they can no longer be accessed or referenced. The garbage collector starts at the root nodes, classes that persist throughout the life of a Java application, and sweeps through all of the nodes that are referenced. As it traverses the nodes, it keeps track of which objects are actively being referenced. Any classes that are no longer being referenced are then eligible to be garbage collected. The memory resources used by these objects can be returned to the Java virtual machine (JVM) when the objects are deleted.
So it is true that Java code does not require the programmer to be responsible for memory management cleanup, and that it automatically garbage collects unused objects. However, the key point to remember is that an object is only counted as being unused when it is no longer referenced. Figure 1 illustrates this concept.
Figure 1. Unused but still referenced
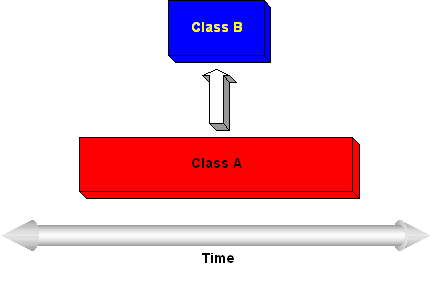
The figure illustrates two classes that have different lifetimes during the execution of a Java application. Class A is instantiated first and exists for a long time or for the entire life of the program. At some point, class B is created, and class A adds a reference to this newly created class. Now let's suppose class B is some user interface widget that is displayed and eventually dismissed by the user. Even though class B is no longer needed, if the reference that class A has to class B is not cleared, class B will continue to exist and to take up memory space even after the next garbage collection cycle is executed.
--------------------------------------------------------------------------------
Back to top
When are memory leaks a concern?
If your program is getting a java.lang.OutOfMemoryError after executing for a while, a memory leak is certainly a strong suspect. Beyond this obvious case, when should memory leaks become a concern? The perfectionist programmer would answer that all memory leaks need to be investigated and corrected. However, there are several other points to consider before jumping to this conclusion, including the lifetime of the program and the size of the leak.
Consider the possibility that the garbage collector may never even run during an application's lifetime. There is no guarantee as to when or if the JVM will invoke the garbage collector -- even if a program explicitly calls System.gc(). Typically, the garbage collector won't be automatically run until a program needs more memory than is currently available. At this point, the JVM will first attempt to make more memory available by invoking the garbage collector. If this attempt still doesn't free enough resources, then the JVM will obtain more memory from the operating system until it finally reaches the maximum allowed.
Take, for example, a small Java application that displays some simple user interface elements for configuration modifications and that has a memory leak. Chances are that the garbage collector will not even be invoked before the application closes, because the JVM will probably have plenty of memory to create all of the objects needed by the program with leftover memory to spare. So, in this case, even though some dead objects are taking up memory while the program is being executed, it really doesn't matter for all practical purposes.
If the Java code being developed is meant to run on a server 24 hours a day, then memory leaks become much more significant than in the case of our configuration utility. Even the smallest leak in some code that is meant to be continuously run will eventually result in the JVM exhausting all of the memory available.
And in the opposite case where a program is relatively short lived, memory limits can be reached by any Java code that allocates a large number of temporary objects (or a handful of objects that eat up large amounts of memory) that are not de-referenced when no longer needed.
One last consideration is that the memory leak isn't a concern at all. Java memory leaks should not be considered as dangerous as leaks that occur in other languages such as C++ where memory is lost and never returned to the operating system. In the case of Java applications, we have unneeded objects clinging to memory resources that have been given to the JVM by the operating system. So in theory, once the Java application and its JVM have been closed, all allocated memory will be returned to the operating system.
--------------------------------------------------------------------------------
Back to top
Determining if an application has memory leaks
To see if a Java application running on a Windows NT platform is leaking memory, you might be tempted to simply observe the memory settings in Task Manager as the application is run. However, after observing a few Java applications at work, you will find that they use a lot of memory compared to native applications. Some Java projects that I have worked on can start out using 10 to 20 MB of system memory. Compare this number to the native Windows Explorer program shipped with the operating system, which uses something on the order of 5 MB.
The other thing to note about Java application memory use is that the typical program running with the IBM JDK 1.1.8 JVM seems to keep gobbling up more and more system memory as it runs. The program never seems to return any memory back to the system until a very large amount of physical memory has been allocated to the application. Could these situations be signs of a memory leak?
To understand what is going on, we need to familiarize ourselves with how the JVM uses system memory for its heap. When running java.exe, you can use certain options to control the startup and maximum size of the garbage-collected heap (-ms and -mx, respectively). The Sun JDK 1.1.8 uses a default 1 MB startup setting and a 16 MB maximum setting. The IBM JDK 1.1.8 uses a default maximum setting of one-half the total physical memory size of the machine. These memory settings have a direct impact on what the JVM does when it runs out of memory. The JVM may continue growing the heap rather than wait for a garbage collection cycle to complete.
So for the purposes of finding and eventually eliminating a memory leak, we are going to need better tools than task monitoring utility programs. Memory debugging programs (see Resources) can come in handy when you're trying to detect memory leaks. These programs typically give you information about the number of objects in the heap, the number of instances of each object, and the memory being using by the objects. In addition, they may also provide useful views showing each object's references and referrers so that you can track down the source of a memory leak.
Next, I will show how I detected and removed a memory leak using the JProbe debugger from Sitraka Software to give you some idea of how these tools can be deployed and the process required to successfully remove a leak.
--------------------------------------------------------------------------------
Back to top
A memory leak example
This example centers on a problem that manifested itself after a tester spent several hours working with a Java JDK 1.1.8 application that my department was developing for commercial release. The underlying code and packages to this Java application were developed by several different groups of programmers over time. The memory leaks that cropped up within the application were caused, I suspect, by programmers who did not truly understand the code that had been developed elsewhere.
The Java code in question allowed a user to create applications for a Palm personal digital assistant without having to write any Palm OS native code. By using a graphical interface, the user could create forms, populate them with controls, and then wire events from these controls to create the Palm application. The tester discovered that the Java application eventually ran out of memory as he created and deleted forms and controls over time. The developers hadn't detected the problem because their machines had more physical memory.
To investigate this problem, I used JProbe to determine what was going wrong. Even with the powerful tools and memory snapshots that JProbe provides, the investigation turned out to be a tedious, iterative process that involved first determining the cause of a given memory leak and then making code changes and verifying the results.
JProbe has several options to control what information is actually recorded during a debugging session. After some experimentation, I decided that the most efficient way to get the information I needed was to turn off the performance data collection and concentrate on the captured heap data. JProbe provides a view called the Runtime Heap Summary that shows the amount of heap memory in use over time as the Java application is running. It also provides a toolbar button to force the JVM to perform garbage collection when desired. This capability turned out to be very useful when trying to see if a given instance of a class would be garbage collected when it was no longer needed by the Java application. Figure 2 shows the amount of heap storage that is in use over time.
Figure 2. Runtime Heap Summary
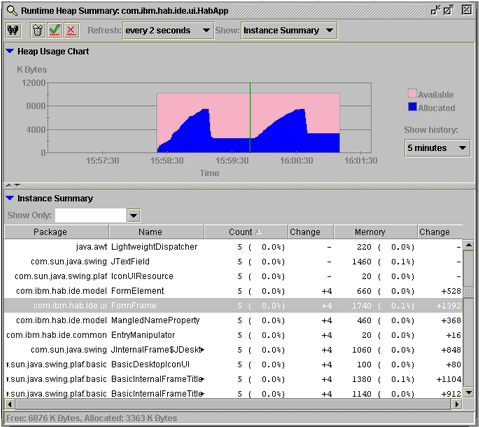
In the Heap Usage Chart, the blue portion indicates the amount of heap space that has been allocated. After I started the Java program and it reached a stable point, I forced the garbage collector to run, which is indicated by the sudden drop in the blue curve before the green line (this line indicates a checkpoint was inserted). Next, I added, then deleted four forms and again invoked the garbage collector. The fact that the level blue area after the checkpoint is higher than the level blue area before the checkpoint tells us that a memory leak is likely, as the program has returned to its initial state of only having a single visible form. I confirmed the leak by looking at the Instance Summary, which indicates that the FormFrame class (which is the main UI class for the forms) has increased in count by four after the checkpoint.
--------------------------------------------------------------------------------
Back to top
Finding the cause
My first step in trying to isolate the problems reported by the tester was to come up with some simple, reproducible test cases. For this example, I found that simply adding a form, deleting the form, and then forcing a garbage collection resulted in many class instances associated with the deleted form to still be alive. This problem was apparent in the JProbe Instance Summary view, which counts the number of instances that are on the heap for each Java class.
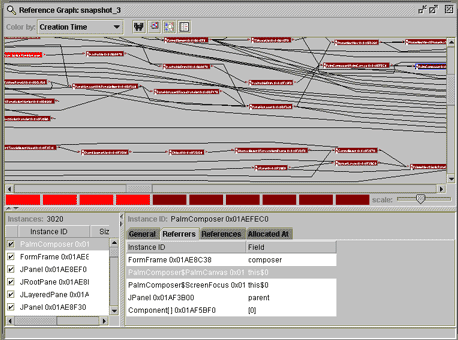
To pinpoint the references that were keeping the garbage collector from properly doing its job, I used JProbe's Reference Graph, shown in Figure 3, to determine which classes were still referencing the now-deleted FormFrame class. This process turned out to be one of the trickiest aspects of debugging this problem as I discovered many different objects were still referencing the unused object. The trial-and-error process of figuring out which of these referrers was truly causing the problem was quite time consuming.
In this case, a root class (upper-left corner in red) is where the problem originated. The class that is highlighted in blue on the right is along the path that has been traced from the original FormFrame class.
Figure 3. Tracing a memory leak in a reference graph
For this specific example, it turned out that the primary culprit was a font manager class that contained a static hashtable. After tracing back through the list of referrers, I found that the root node was a static hashtable that stored the fonts in use for each form. The various forms could be zoomed in or out independently, so the hashtable contained a vector with all of the fonts for a given form. When the zoom view of the form was changed, the vector of fonts was fetched and the appropriate zoom factor was applied to the font sizes.
The problem with this font manager class was that while the code put the font vector into the hashtable when the form was created, no provision was ever made to remove the vector when the form was deleted. Therefore, this static hashtable, which essentially existed for the life of the application itself, was never removing the keys that referenced each form. Consequently, the form and all of its associated classes were left dangling in memory.
--------------------------------------------------------------------------------
Back to top
Applying a fix
The simple solution to this problem was to add a method to the font manager class that allowed the hashtable's remove() method to be called with the appropriate key when the form was deleted by the user. The removeKeyFromHashtables() method is shown below:
public void removeKeyFromHashtables(GraphCanvas graph) {
if (graph != null) {
viewFontTable.remove(graph); // remove key from hashtable
// to prevent memory leak
}
}
Next, I added a call to this method to the FormFrame class. FormFrame uses Swing's internal frames to actually implement the form UI, so the call to the font manager was added to the method that is executed when an internal frame has completely closed, as shown here:
/**
* Invoked when a FormFrame is disposed. Clean out references to prevent
* memory leaks.
*/
public void internalFrameClosed(InternalFrameEvent e) {
FontManager.get().removeKeyFromHashtables(canvas);
canvas = null;
setDesktopIcon(null);
}
After I made these code changes, I used the debugger to verify that the object count associated with the deleted form decreased when the same test case was executed.
--------------------------------------------------------------------------------
Back to top
Preventing memory leaks
You can prevent memory leaks by watching for some common problems. Collection classes, such as hashtables and vectors, are common places to find the cause of a memory leak. This is particularly true if the class has been declared static and exists for the life of the application.
Another common problem occurs when you register a class as an event listener without bothering to unregister when the class is no longer needed. Also, many times member variables of a class that point to other classes simply need to be set to null at the appropriate time.
--------------------------------------------------------------------------------
Back to top
Conclusion
Finding the cause of a memory leak can be a tedious process, not to mention one that will require special debugging tools. However, once you become familiar with the tools and the patterns to look for in tracing object references, you will be able to track down memory leaks. In addition, you'll gain some valuable skills that may not only save a programming project, but also provide insight as to what coding practices to avoid to prevent memory leaks in future projects.
Resources
Quest Software's JProbe Suite
Borland's Optimizeit Enterprise Suite
Paul Moeller's Win32 Java Heap Inspector
Handling memory leaks in Java programsFind out when memory leaks are a concern and how to prevent them
Jim Patrick ([email protected]), Advisory Programmer, IBM Pervasive Computing
Jim Patrick is an Advisory Programmer in IBM's Pervasive Computing Division. He has been programming in Java since 1996. Contact Jim at [email protected].
Summary: Memory leaks in Java programs? Absolutely. Contrary to popular belief, memory management is still a consideration in Java programming. In this article, you'll learn what causes Java memory leaks and when these leaks should be of concern. You'll also get a quick hands-on lesson for tackling leaks in your own projects.
How memory leaks manifest themselves in Java programs
Most programmers know that one of the beauties of using a programming language such as Java is that they no longer have to worry about allocating and freeing memory. You simply create objects, and Java takes care of removing them when they are no longer needed by the application through a mechanism known as garbage collection. This process means that Java has solved one of the nasty problems that plague other programming languages -- the dreaded memory leak. Or has it?
Before we get too deep into our discussion, let's begin by reviewing how garbage collection actually works. The job of the garbage collector is to find objects that are no longer needed by an application and to remove them when they can no longer be accessed or referenced. The garbage collector starts at the root nodes, classes that persist throughout the life of a Java application, and sweeps through all of the nodes that are referenced. As it traverses the nodes, it keeps track of which objects are actively being referenced. Any classes that are no longer being referenced are then eligible to be garbage collected. The memory resources used by these objects can be returned to the Java virtual machine (JVM) when the objects are deleted.
So it is true that Java code does not require the programmer to be responsible for memory management cleanup, and that it automatically garbage collects unused objects. However, the key point to remember is that an object is only counted as being unused when it is no longer referenced. Figure 1 illustrates this concept.
Figure 1. Unused but still referenced

The figure illustrates two classes that have different lifetimes during the execution of a Java application. Class A is instantiated first and exists for a long time or for the entire life of the program. At some point, class B is created, and class A adds a reference to this newly created class. Now let's suppose class B is some user interface widget that is displayed and eventually dismissed by the user. Even though class B is no longer needed, if the reference that class A has to class B is not cleared, class B will continue to exist and to take up memory space even after the next garbage collection cycle is executed.
--------------------------------------------------------------------------------
Back to top
When are memory leaks a concern?
If your program is getting a java.lang.OutOfMemoryError after executing for a while, a memory leak is certainly a strong suspect. Beyond this obvious case, when should memory leaks become a concern? The perfectionist programmer would answer that all memory leaks need to be investigated and corrected. However, there are several other points to consider before jumping to this conclusion, including the lifetime of the program and the size of the leak.
Consider the possibility that the garbage collector may never even run during an application's lifetime. There is no guarantee as to when or if the JVM will invoke the garbage collector -- even if a program explicitly calls System.gc(). Typically, the garbage collector won't be automatically run until a program needs more memory than is currently available. At this point, the JVM will first attempt to make more memory available by invoking the garbage collector. If this attempt still doesn't free enough resources, then the JVM will obtain more memory from the operating system until it finally reaches the maximum allowed.
Take, for example, a small Java application that displays some simple user interface elements for configuration modifications and that has a memory leak. Chances are that the garbage collector will not even be invoked before the application closes, because the JVM will probably have plenty of memory to create all of the objects needed by the program with leftover memory to spare. So, in this case, even though some dead objects are taking up memory while the program is being executed, it really doesn't matter for all practical purposes.
If the Java code being developed is meant to run on a server 24 hours a day, then memory leaks become much more significant than in the case of our configuration utility. Even the smallest leak in some code that is meant to be continuously run will eventually result in the JVM exhausting all of the memory available.
And in the opposite case where a program is relatively short lived, memory limits can be reached by any Java code that allocates a large number of temporary objects (or a handful of objects that eat up large amounts of memory) that are not de-referenced when no longer needed.
One last consideration is that the memory leak isn't a concern at all. Java memory leaks should not be considered as dangerous as leaks that occur in other languages such as C++ where memory is lost and never returned to the operating system. In the case of Java applications, we have unneeded objects clinging to memory resources that have been given to the JVM by the operating system. So in theory, once the Java application and its JVM have been closed, all allocated memory will be returned to the operating system.
--------------------------------------------------------------------------------
Back to top
Determining if an application has memory leaks
To see if a Java application running on a Windows NT platform is leaking memory, you might be tempted to simply observe the memory settings in Task Manager as the application is run. However, after observing a few Java applications at work, you will find that they use a lot of memory compared to native applications. Some Java projects that I have worked on can start out using 10 to 20 MB of system memory. Compare this number to the native Windows Explorer program shipped with the operating system, which uses something on the order of 5 MB.
The other thing to note about Java application memory use is that the typical program running with the IBM JDK 1.1.8 JVM seems to keep gobbling up more and more system memory as it runs. The program never seems to return any memory back to the system until a very large amount of physical memory has been allocated to the application. Could these situations be signs of a memory leak?
To understand what is going on, we need to familiarize ourselves with how the JVM uses system memory for its heap. When running java.exe, you can use certain options to control the startup and maximum size of the garbage-collected heap (-ms and -mx, respectively). The Sun JDK 1.1.8 uses a default 1 MB startup setting and a 16 MB maximum setting. The IBM JDK 1.1.8 uses a default maximum setting of one-half the total physical memory size of the machine. These memory settings have a direct impact on what the JVM does when it runs out of memory. The JVM may continue growing the heap rather than wait for a garbage collection cycle to complete.
So for the purposes of finding and eventually eliminating a memory leak, we are going to need better tools than task monitoring utility programs. Memory debugging programs (see Resources) can come in handy when you're trying to detect memory leaks. These programs typically give you information about the number of objects in the heap, the number of instances of each object, and the memory being using by the objects. In addition, they may also provide useful views showing each object's references and referrers so that you can track down the source of a memory leak.
Next, I will show how I detected and removed a memory leak using the JProbe debugger from Sitraka Software to give you some idea of how these tools can be deployed and the process required to successfully remove a leak.
--------------------------------------------------------------------------------
Back to top
A memory leak example
This example centers on a problem that manifested itself after a tester spent several hours working with a Java JDK 1.1.8 application that my department was developing for commercial release. The underlying code and packages to this Java application were developed by several different groups of programmers over time. The memory leaks that cropped up within the application were caused, I suspect, by programmers who did not truly understand the code that had been developed elsewhere.
The Java code in question allowed a user to create applications for a Palm personal digital assistant without having to write any Palm OS native code. By using a graphical interface, the user could create forms, populate them with controls, and then wire events from these controls to create the Palm application. The tester discovered that the Java application eventually ran out of memory as he created and deleted forms and controls over time. The developers hadn't detected the problem because their machines had more physical memory.
To investigate this problem, I used JProbe to determine what was going wrong. Even with the powerful tools and memory snapshots that JProbe provides, the investigation turned out to be a tedious, iterative process that involved first determining the cause of a given memory leak and then making code changes and verifying the results.
JProbe has several options to control what information is actually recorded during a debugging session. After some experimentation, I decided that the most efficient way to get the information I needed was to turn off the performance data collection and concentrate on the captured heap data. JProbe provides a view called the Runtime Heap Summary that shows the amount of heap memory in use over time as the Java application is running. It also provides a toolbar button to force the JVM to perform garbage collection when desired. This capability turned out to be very useful when trying to see if a given instance of a class would be garbage collected when it was no longer needed by the Java application. Figure 2 shows the amount of heap storage that is in use over time.
Figure 2. Runtime Heap Summary

In the Heap Usage Chart, the blue portion indicates the amount of heap space that has been allocated. After I started the Java program and it reached a stable point, I forced the garbage collector to run, which is indicated by the sudden drop in the blue curve before the green line (this line indicates a checkpoint was inserted). Next, I added, then deleted four forms and again invoked the garbage collector. The fact that the level blue area after the checkpoint is higher than the level blue area before the checkpoint tells us that a memory leak is likely, as the program has returned to its initial state of only having a single visible form. I confirmed the leak by looking at the Instance Summary, which indicates that the FormFrame class (which is the main UI class for the forms) has increased in count by four after the checkpoint.
--------------------------------------------------------------------------------
Back to top
Finding the cause
My first step in trying to isolate the problems reported by the tester was to come up with some simple, reproducible test cases. For this example, I found that simply adding a form, deleting the form, and then forcing a garbage collection resulted in many class instances associated with the deleted form to still be alive. This problem was apparent in the JProbe Instance Summary view, which counts the number of instances that are on the heap for each Java class.
To pinpoint the references that were keeping the garbage collector from properly doing its job, I used JProbe's Reference Graph, shown in Figure 3, to determine which classes were still referencing the now-deleted FormFrame class. This process turned out to be one of the trickiest aspects of debugging this problem as I discovered many different objects were still referencing the unused object. The trial-and-error process of figuring out which of these referrers was truly causing the problem was quite time consuming.
In this case, a root class (upper-left corner in red) is where the problem originated. The class that is highlighted in blue on the right is along the path that has been traced from the original FormFrame class.
Figure 3. Tracing a memory leak in a reference graph

For this specific example, it turned out that the primary culprit was a font manager class that contained a static hashtable. After tracing back through the list of referrers, I found that the root node was a static hashtable that stored the fonts in use for each form. The various forms could be zoomed in or out independently, so the hashtable contained a vector with all of the fonts for a given form. When the zoom view of the form was changed, the vector of fonts was fetched and the appropriate zoom factor was applied to the font sizes.
The problem with this font manager class was that while the code put the font vector into the hashtable when the form was created, no provision was ever made to remove the vector when the form was deleted. Therefore, this static hashtable, which essentially existed for the life of the application itself, was never removing the keys that referenced each form. Consequently, the form and all of its associated classes were left dangling in memory.
--------------------------------------------------------------------------------
Back to top
Applying a fix
The simple solution to this problem was to add a method to the font manager class that allowed the hashtable's remove() method to be called with the appropriate key when the form was deleted by the user. The removeKeyFromHashtables() method is shown below:
public void removeKeyFromHashtables(GraphCanvas graph) {
if (graph != null) {
viewFontTable.remove(graph); // remove key from hashtable
// to prevent memory leak
}
}
Next, I added a call to this method to the FormFrame class. FormFrame uses Swing's internal frames to actually implement the form UI, so the call to the font manager was added to the method that is executed when an internal frame has completely closed, as shown here:
/**
* Invoked when a FormFrame is disposed. Clean out references to prevent
* memory leaks.
*/
public void internalFrameClosed(InternalFrameEvent e) {
FontManager.get().removeKeyFromHashtables(canvas);
canvas = null;
setDesktopIcon(null);
}
After I made these code changes, I used the debugger to verify that the object count associated with the deleted form decreased when the same test case was executed.
--------------------------------------------------------------------------------
Back to top
Preventing memory leaks
You can prevent memory leaks by watching for some common problems. Collection classes, such as hashtables and vectors, are common places to find the cause of a memory leak. This is particularly true if the class has been declared static and exists for the life of the application.
Another common problem occurs when you register a class as an event listener without bothering to unregister when the class is no longer needed. Also, many times member variables of a class that point to other classes simply need to be set to null at the appropriate time.
--------------------------------------------------------------------------------
Back to top
Conclusion
Finding the cause of a memory leak can be a tedious process, not to mention one that will require special debugging tools. However, once you become familiar with the tools and the patterns to look for in tracing object references, you will be able to track down memory leaks. In addition, you'll gain some valuable skills that may not only save a programming project, but also provide insight as to what coding practices to avoid to prevent memory leaks in future projects.
Resources
Quest Software's JProbe Suite
Borland's Optimizeit Enterprise Suite
Paul Moeller's Win32 Java Heap Inspector