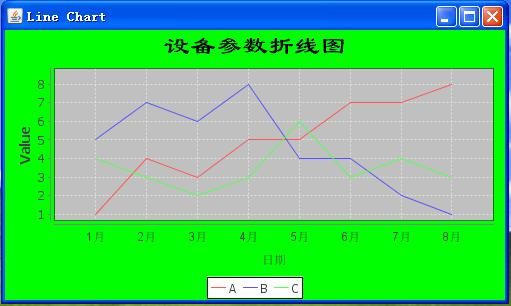
JFreeChart类生成折线图的Java源代码
import java.awt.BasicStroke;
import java.awt.Color;
import java.awt.Polygon;
import java.awt.Shape;
import java.awt.geom.Rectangle2D;

import org.jfree.chart.ChartFactory;
import org.jfree.chart.ChartPanel;
import org.jfree.chart.JFreeChart;
import org.jfree.chart.axis.NumberAxis;
import org.jfree.chart.plot.CategoryPlot;
import org.jfree.chart.plot.DefaultDrawingSupplier;
import org.jfree.chart.plot.DrawingSupplier;
import org.jfree.chart.plot.PlotOrientation;
import org.jfree.chart.renderer.category.LineAndShapeRenderer;
import org.jfree.data.category.CategoryDataset;
import org.jfree.data.category.DefaultCategoryDataset;
import org.jfree.ui.ApplicationFrame;
import org.jfree.ui.RefineryUtilities;

/**
* A line chart demo showing the use of a custom drawing supplier.
*
*/
public class LineChartDemo5 extends ApplicationFrame {

/**
* Creates a new demo.
*
* @param title the frame title.
*/
public LineChartDemo5(final String title) {
super(title);
final CategoryDataset dataset = createDataset();
final JFreeChart chart = createChart(dataset);
final ChartPanel chartPanel = new ChartPanel(chart);
chartPanel.setPreferredSize(new java.awt.Dimension(500, 270));
setContentPane(chartPanel);

}

/**
* Creates a sample dataset.
*
* @return a sample dataset.
*/
private CategoryDataset createDataset() {

// row keys...
final String series1 = "First";
final String series2 = "Second";
final String series3 = "Third";

// column keys...
final String type1 = "Type 1";
final String type2 = "Type 2";
final String type3 = "Type 3";
final String type4 = "Type 4";
final String type5 = "Type 5";
final String type6 = "Type 6";
final String type7 = "Type 7";
final String type8 = "Type 8";

// create the dataset...
final DefaultCategoryDataset dataset = new DefaultCategoryDataset();

dataset.addValue(1.0, series1, type1);
dataset.addValue(4.0, series1, type2);
dataset.addValue(3.0, series1, type3);
dataset.addValue(5.0, series1, type4);
dataset.addValue(5.0, series1, type5);
dataset.addValue(7.0, series1, type6);
dataset.addValue(7.0, series1, type7);
dataset.addValue(8.0, series1, type8);

dataset.addValue(5.0, series2, type1);
dataset.addValue(7.0, series2, type2);
dataset.addValue(6.0, series2, type3);
dataset.addValue(8.0, series2, type4);
dataset.addValue(4.0, series2, type5);
dataset.addValue(4.0, series2, type6);
dataset.addValue(2.0, series2, type7);
dataset.addValue(1.0, series2, type8);

dataset.addValue(4.0, series3, type1);
dataset.addValue(3.0, series3, type2);
dataset.addValue(2.0, series3, type3);
dataset.addValue(3.0, series3, type4);
dataset.addValue(6.0, series3, type5);
dataset.addValue(3.0, series3, type6);
dataset.addValue(4.0, series3, type7);
dataset.addValue(3.0, series3, type8);

return dataset;

}

/**
* Creates a sample chart.
*
* @param dataset the dataset.
*
* @return a chart.
*/
private JFreeChart createChart(final CategoryDataset dataset) {

final JFreeChart chart = ChartFactory.createLineChart(
"Line Chart Demo 5", // chart title
"Type", // domain axis label
"Value", // range axis label
dataset, // data
PlotOrientation.VERTICAL, // orientation
true, // include legend
true, // tooltips
false // urls
);

// final StandardLegend legend = (StandardLegend) chart.getLegend();
// legend.setDisplaySeriesShapes(true);

final Shape[] shapes = new Shape[3];
int[] xpoints;
int[] ypoints;

// right-pointing triangle
xpoints = new int[] {-3, 3, -3};
ypoints = new int[] {-3, 0, 3};
shapes[0] = new Polygon(xpoints, ypoints, 3);

// vertical rectangle
shapes[1] = new Rectangle2D.Double(-2, -3, 3, 6);

// left-pointing triangle
xpoints = new int[] {-3, 3, 3};
ypoints = new int[] {0, -3, 3};
shapes[2] = new Polygon(xpoints, ypoints, 3);

final DrawingSupplier supplier = new DefaultDrawingSupplier(
DefaultDrawingSupplier.DEFAULT_PAINT_SEQUENCE,
DefaultDrawingSupplier.DEFAULT_OUTLINE_PAINT_SEQUENCE,
DefaultDrawingSupplier.DEFAULT_STROKE_SEQUENCE,
DefaultDrawingSupplier.DEFAULT_OUTLINE_STROKE_SEQUENCE,
shapes
);
final CategoryPlot plot = chart.getCategoryPlot();
plot.setDrawingSupplier(supplier);

chart.setBackgroundPaint(Color.yellow);

// set the stroke for each series...
plot.getRenderer().setSeriesStroke(
0,
new BasicStroke(
2.0f, BasicStroke.CAP_ROUND, BasicStroke.JOIN_ROUND,
1.0f, new float[] {10.0f, 6.0f}, 0.0f
)
);
plot.getRenderer().setSeriesStroke(
1,
new BasicStroke(
2.0f, BasicStroke.CAP_ROUND, BasicStroke.JOIN_ROUND,
1.0f, new float[] {6.0f, 6.0f}, 0.0f
)
);
plot.getRenderer().setSeriesStroke(
2,
new BasicStroke(
2.0f, BasicStroke.CAP_ROUND, BasicStroke.JOIN_ROUND,
1.0f, new float[] {2.0f, 6.0f}, 0.0f
)
);

// customise the renderer...
final LineAndShapeRenderer renderer = (LineAndShapeRenderer) plot.getRenderer();
// renderer.setDrawShapes(true);
renderer.setItemLabelsVisible(true);
// renderer.setLabelGenerator(new StandardCategoryLabelGenerator());

// customise the range axis...
final NumberAxis rangeAxis = (NumberAxis) plot.getRangeAxis();
rangeAxis.setStandardTickUnits(NumberAxis.createIntegerTickUnits());
rangeAxis.setAutoRangeIncludesZero(false);
rangeAxis.setUpperMargin(0.12);

return chart;

}

public static void main(final String[] args) {

final LineChartDemo5 demo = new LineChartDemo5("Line Chart Demo 5");
demo.pack();
RefineryUtilities.centerFrameOnScreen(demo);
demo.setVisible(true);

}

}
