JBPM in a Jboss Cluster
Mission / scope
The goal of this article is to show how to achieve near-linear scalability of jBPM workflow engine by tuning its configuration and setting it up on a JBoss cluster with distributed TreeCache. Readers will be guided through all steps required to cluster jBPM efficiently – from cluster setup to fine-tuning jBPM configuration – and provided with performance test results as well as various tips and tricks allowing to achieve maximum performance.
Abstract
jBPM is a powerful workflow engine – robust, extensible and fast. However, what are the possibilities if we need more performance than one server can offer? Clustering is the solution that immediately springs to mind. But is it quickly and easily feasible and, more importantly, does it yield expected results? This article takes you through the process of setting up a JBoss cluster together with a distributed TreeCache and tuning jBPM to deliver its full performance. You will also learn what scale of improvement you can expect over standard configuration.
Introduction to jBPM
jBPM is a workflow engine enabling its users to easily manage various kinds of business processes. It is based around a process definition, which can consist of activities. Similar or related activities can be grouped in scopes. Activities can be triggered either manually or scheduled for later execution. That's where JobExecutors come into play. They poll the database and check whether there are any jobs available for execution. Whenever a job is available and its execution time is due, JobExecutor puts a lock on it and executes any actions connected with the job. Such a timed execution is called automatic escalation and it is the main focus of this article.
Business background
We have developed a business process management application based on a stack of cutting edge technologies including jBPM. The main business unit in our system bears the name Call. Our client's focus was put mainly on scalability and performance of workflow engine, therefore a lot of effort was put into testing and tuning clustered jBPM configuration. My goal was to cluster and tune automatic Call escalations to meet customer's requirements with regards to installation size and usage profile.
Test environment overview
The test environment consists of 4 separate machines to run the application, all connecting to an Oracle 10g database. Server instances are running Ubuntu Server 8.10 Linux and JBoss 4.2.3GA, each has a quad-core Q9300 Intel processor running at 2.50GHz and 4GB of RAM memory. JBoss instances communicate with each other using JGroups protocol. Library versions are summarized at the end of this article.
System preparation and cluster setup
In order to avoid serious problems with jBPM job ownership and execution further down the road, the following steps need to be taken:
- /etc/hosts needs to have an entry with the same IP address as JBoss is bound to (this applies to every node) use workaround and example #1 described here: http://bugs.sun.com/bugdatabase/view_bug.do?bug_id=4665037
i.e. the InetAddress.getLocalHost() method has to return a non-loopback address - all nodes need to have their clocks synchronized by ntpd
JBoss clustering is easy to set up, it is enough to either use the „all” configuration (for development and testing purposes) or to enrich your configuration with the following files from „all”:
- deploy/cache-invalidation-service.xml
- deploy/cluster-service.xml
- deploy/deploy.last/farm-service.xml
- lib/jbossha.jar
- lib/jgroups.jar
Log4j configuration
We have to be sure that we see messages related to our new setup. The following lines in jboss-log4j.xml will allow us to verify that the cluster is working correctly without cluttering our console with too verbose output:
  <logger name="org.jboss.cache">
    <level value="INFO"/>
  </logger>
  <!-- Keep chatty support libraries as silent as possible -->
  <logger name="org.jgroups.protocols.UDP">
    <level value="ERROR"/>
  </logger>
  <!-- Limit the org.jgroups logger to WARN as its INFO is verbose -->
  <logger name="org.jgroups">
    <level value="WARN"/>
  </logger>
  <!-- Clustering logging -->
  <logger name="org.jgroups">
    <level value="INFO" />
  </logger>
  <logger name="org.jboss.ha">
    <level value="INFO" />
  </logger>
Time to start JBoss
We can now run JBoss with ./run.sh -c <config_name> -b <bind_address> command. On the console you should see messages similar to these:
12:48:23,783 INFO                jgroups.JChannel| JGroups version: 2.4.1 SP-4
12:48:24,098 INFO                 protocols.FRAG2| frag_size=60000, overhead=200, new frag_size=59800
12:48:24,102 INFO                 protocols.FRAG2| received CONFIG event: {bind_addr=/10.10.1.43}
12:48:24,187 INFO    HAPartition.DefaultPartition| Initializing
12:48:24,232 INFO                          STDOUT|
-------------------------------------------------------
GMS: address is 10.10.1.43:46941
-------------------------------------------------------
12:48:26,335 INFO    HAPartition.DefaultPartition| Number of cluster members: 4
12:48:26,335 INFO    HAPartition.DefaultPartition| Other members: 3
12:48:26,335 INFO    HAPartition.DefaultPartition| Fetching state (will wait for 30000 milliseconds):
12:48:26,393 INFO    HAPartition.DefaultPartition| state was retrieved successfully (in 58 milliseconds)
12:48:26,449 INFO            jndi.HANamingService| Started ha-jndi bootstrap jnpPort=1100, backlog=50, bindAddress=/10.10.1.43
12:48:26,457 INFO  mingService$AutomaticDiscovery| Listening on /10.10.1.43:1102, group=230.0.0.4, HA-JNDI address=10.10.1.43:1100
As you can see, a cluster of 4 nodes has been formed, now we can deploy the application. JBoss provides a farming mechanism, which can be used to deploy an application to all cluster members in one move. Simply drop your EAR or WAR in server/<config_name>/farm/ directory and it will be automatically deployed on all nodes. Removing the application file results in undeployment on all nodes.
jBPM in a cluster
jBPM 3.2 is designed to work seamlessly in a cluster. All application instances are independent, effectively knowing nothing of each other. Job distribution happens through use of database-level locks and job ownership includes information about thread name and host.
When a job is ready to be executed and not locked yet, JobExecutors will try to put a lock on it. Due to use of optimistic locking, only one of them will succeed, the ones that got an OptimisticLockingException will pause for a defined time before acquiring new jobs.
Caching jBPM in a multi-server environment
"The second level cache is an important aspect of the JBoss jBPM implementation. If it weren't for this cache, JBoss jBPM could have a serious drawback in comparison to the other techniques to implement a BPM engine."
- jBPM jPDL User Guide
jBPM entity classes are cached by default. Their cache configuration, however, is prepared for local deployment only – they use a nonstrict-read-write strategy, which is unsupported by JBoss Cache. How can you change the strategy to transactional ? You have to override the Hibernate mappings of jBPM entities. You can do this by manually defining a list of mapping resources in your SessionFactory bean.
<bean id="myAppSessionFactory" class="org.springframework.orm.hibernate3.LocalSessionFactoryBean">
  <property name="dataSource">
    <ref bean="..."/>
  </property>
  <property name="mappingResources">
    <list>
      <value>classpath*:com/yourcompany/jbpm/**/*.hbm.xml</value>
      <!--<value>classpath*:org/jbpm/**/*.hbm.xml</value>-->
      <value>classpath*:org/jbpm/bytes/ByteArray.hbm.xml</value>
      <value>classpath*:org/jbpm/context/def/ContextDefinition.hbm.xml</value>
      <!--<value>classpath*:org/jbpm/context/def/VariableAccess.hbm.xml</value>-->
      <value>classpath*:org/jbpm/context/exe/ContextInstance.hbm.xml</value>
      <value>classpath*:org/jbpm/context/exe/TokenVariableMap.hbm.xml</value>
      <value>classpath*:org/jbpm/context/exe/VariableInstance.hbm.xml</value>
      <value>classpath*:org/jbpm/context/exe/variableinstance/ByteArrayInstance.hbm.xml</value>
      <value>classpath*:org/jbpm/context/exe/variableinstance/DateInstance.hbm.xml</value>
      <value>classpath*:org/jbpm/context/exe/variableinstance/DoubleInstance.hbm.xml</value>
      <value>classpath*:org/jbpm/context/exe/variableinstance/HibernateLongInstance.hbm.xml</value>
      <value>classpath*:org/jbpm/context/exe/variableinstance/HibernateStringInstance.hbm.xml
      </value>
      <value>classpath*:org/jbpm/context/exe/variableinstance/JcrNodeInstance.hbm.xml</value>
      <value>classpath*:org/jbpm/context/exe/variableinstance/LongInstance.hbm.xml</value>
      <value>classpath*:org/jbpm/context/exe/variableinstance/NullInstance.hbm.xml</value>
      <value>classpath*:org/jbpm/context/exe/variableinstance/StringInstance.hbm.xml</value>
      <value>classpath*:org/jbpm/context/log/VariableLog.hbm.xml</value>
      <value>classpath*:org/jbpm/context/log/VariableCreateLog.hbm.xml</value>
      <value>classpath*:org/jbpm/context/log/VariableDeleteLog.hbm.xml</value>
      <value>classpath*:org/jbpm/context/log/VariableUpdateLog.hbm.xml</value>
      <value>classpath*:org/jbpm/context/log/variableinstance/ByteArrayUpdateLog.hbm.xml</value>
      <value>classpath*:org/jbpm/context/log/variableinstance/DateUpdateLog.hbm.xml</value>
      <value>classpath*:org/jbpm/context/log/variableinstance/DoubleUpdateLog.hbm.xml</value>
      <value>classpath*:org/jbpm/context/log/variableinstance/HibernateLongUpdateLog.hbm.xml
      </value>
      <value>classpath*:org/jbpm/context/log/variableinstance/HibernateStringUpdateLog.hbm.xml
      </value>
      <value>classpath*:org/jbpm/context/log/variableinstance/LongUpdateLog.hbm.xml</value>
      <value>classpath*:org/jbpm/context/log/variableinstance/StringUpdateLog.hbm.xml</value>
      <value>classpath*:org/jbpm/db/hibernate.queries.hbm.xml</value>
      <!--<value>classpath*:org/jbpm/file/def/FileDefinition.hbm.xml</value>-->
      <value>classpath*:org/jbpm/graph/action/MailAction.hbm.xml</value>
      <!--<value>classpath*:org/jbpm/graph/action/Script.hbm.xml</value>-->
      <!--<value>classpath*:org/jbpm/graph/def/ProcessDefinition.hbm.xml</value>-->
      <!--<value>classpath*:org/jbpm/graph/def/Node.hbm.xml</value>-->
      <!--<value>classpath*:org/jbpm/graph/def/Transition.hbm.xml</value>-->
      <!--<value>classpath*:org/jbpm/graph/def/Event.hbm.xml</value>-->
      <!--<value>classpath*:org/jbpm/graph/def/Action.hbm.xml</value>-->
      <!--<value>classpath*:org/jbpm/graph/def/SuperState.hbm.xml</value>-->
      <!--<value>classpath*:org/jbpm/graph/def/ExceptionHandler.hbm.xml</value>-->
      <value>classpath*:org/jbpm/graph/exe/Comment.hbm.xml</value>
      <value>classpath*:org/jbpm/graph/exe/ProcessInstance.hbm.xml</value>
      <value>classpath*:org/jbpm/graph/exe/Token.hbm.xml</value>
      <value>classpath*:org/jbpm/graph/exe/RuntimeAction.hbm.xml</value>
      <value>classpath*:org/jbpm/graph/log/ActionLog.hbm.xml</value>
      <value>classpath*:org/jbpm/graph/log/NodeLog.hbm.xml</value>
      <value>classpath*:org/jbpm/graph/log/ProcessInstanceCreateLog.hbm.xml</value>
      <value>classpath*:org/jbpm/graph/log/ProcessInstanceEndLog.hbm.xml</value>
      <value>classpath*:org/jbpm/graph/log/ProcessStateLog.hbm.xml</value>
      <value>classpath*:org/jbpm/graph/log/SignalLog.hbm.xml</value>
      <value>classpath*:org/jbpm/graph/log/TokenCreateLog.hbm.xml</value>
      <value>classpath*:org/jbpm/graph/log/TokenEndLog.hbm.xml</value>
      <value>classpath*:org/jbpm/graph/log/TransitionLog.hbm.xml</value>
      <value>classpath*:org/jbpm/graph/node/StartState.hbm.xml</value>
      <value>classpath*:org/jbpm/graph/node/EndState.hbm.xml</value>
      <!--<value>classpath*:org/jbpm/graph/node/ProcessState.hbm.xml</value>-->
      <!--<value>classpath*:org/jbpm/graph/node/Decision.hbm.xml</value>-->
      <value>classpath*:org/jbpm/graph/node/Fork.hbm.xml</value>
      <value>classpath*:org/jbpm/graph/node/Join.hbm.xml</value>
      <value>classpath*:org/jbpm/graph/node/State.hbm.xml</value>
      <!--<value>classpath*:org/jbpm/graph/node/TaskNode.hbm.xml</value>-->
      <value>classpath*:org/jbpm/graph/node/MailNode.hbm.xml</value>
      <!--<value>classpath*:org/jbpm/instantiation/Delegation.hbm.xml</value>-->
      <value>classpath*:org/jbpm/job/ExecuteActionJob.hbm.xml</value>
      <value>classpath*:org/jbpm/job/ExecuteNodeJob.hbm.xml</value>
      <value>classpath*:org/jbpm/job/Job.hbm.xml</value>
      <value>classpath*:org/jbpm/job/Timer.hbm.xml</value>
      <value>classpath*:org/jbpm/logging/log/ProcessLog.hbm.xml</value>
      <value>classpath*:org/jbpm/logging/log/MessageLog.hbm.xml</value>
      <value>classpath*:org/jbpm/logging/log/CompositeLog.hbm.xml</value>
      <!--<value>classpath*:org/jbpm/module/def/ModuleDefinition.hbm.xml</value>-->
      <value>classpath*:org/jbpm/module/exe/ModuleInstance.hbm.xml</value>
      <value>classpath*:org/jbpm/scheduler/def/CreateTimerAction.hbm.xml</value>
      <value>classpath*:org/jbpm/scheduler/def/CancelTimerAction.hbm.xml</value>
      <!--<value>classpath*:org/jbpm/taskmgmt/def/TaskMgmtDefinition.hbm.xml</value>-->
      <!--<value>classpath*:org/jbpm/taskmgmt/def/Swimlane.hbm.xml</value>-->
      <!--<value>classpath*:org/jbpm/taskmgmt/def/Task.hbm.xml</value>-->
      <!--<value>classpath*:org/jbpm/taskmgmt/def/TaskController.hbm.xml</value>-->
      <value>classpath*:org/jbpm/taskmgmt/exe/TaskMgmtInstance.hbm.xml</value>
      <value>classpath*:org/jbpm/taskmgmt/exe/TaskInstance.hbm.xml</value>
      <value>classpath*:org/jbpm/taskmgmt/exe/PooledActor.hbm.xml</value>
      <value>classpath*:org/jbpm/taskmgmt/exe/SwimlaneInstance.hbm.xml</value>
      <value>classpath*:org/jbpm/taskmgmt/log/TaskLog.hbm.xml</value>
      <value>classpath*:org/jbpm/taskmgmt/log/TaskCreateLog.hbm.xml</value>
      <value>classpath*:org/jbpm/taskmgmt/log/TaskAssignLog.hbm.xml</value>
      <value>classpath*:org/jbpm/taskmgmt/log/TaskEndLog.hbm.xml</value>
      <value>classpath*:org/jbpm/taskmgmt/log/SwimlaneLog.hbm.xml</value>
      <value>classpath*:org/jbpm/taskmgmt/log/SwimlaneCreateLog.hbm.xml</value>
      <value>classpath*:org/jbpm/taskmgmt/log/SwimlaneAssignLog.hbm.xml</value>
    </list>
  </property>
</bean>
The list consists of all mapped jBPM entities less the cached ones (they are commented out). In order to keep the mapping complete, you need to copy the commented out hbm.xml mapping files to your project and change their caching strategy definition from:
<cache usage="nonstrict-read-write"/>
to:
<cache usage="transactional"/>
Keep these files in a package defined in the first line of mappingResources list, they will get picked up automatically.
Please note that the transactional caching strategy will work only with a JTA transaction manager in your application! You have to define Hibernate property hibernate.transaction.manager_lookup_class to point to your transaction manager lookup class.
Using JBoss TreeCache as Hibernate's 2nd level cache
Preparation of TreeCache for use in your application takes a few, rather lengthy steps. But fear not, after all it is not very complicated. First, you have to create a cache MBean and save its definition in a file named jboss-service.xml:
<mbean code="org.jboss.cache.TreeCache" name="jboss.cache:service=TreeCache">
  <depends>jboss:service=Naming</depends>
  <depends>jboss:service=TransactionManager</depends>

  <!-- Configure the TransactionManager -->
  <attribute name="TransactionManagerLookupClass">org.jboss.cache.JBossTransactionManagerLookup</attribute>

  <!--
      Node locking scheme :
                PESSIMISTIC (default)
                OPTIMISTIC
  -->
  <attribute name="NodeLockingScheme">OPTIMISTIC</attribute>

  <!--
          Node locking isolation level :
                 SERIALIZABLE
                               REPEATABLE_READ (default)
                               READ_COMMITTED
                               READ_UNCOMMITTED
                               NONE

      (ignored if NodeLockingScheme is OPTIMISTIC)
  -->
  <attribute name="IsolationLevel">REPEATABLE_READ</attribute>

  <!--     Valid modes are LOCAL
                           REPL_ASYNC
                           REPL_SYNC
                           INVALIDATION_ASYNC
                           INVALIDATION_SYNC
  -->
  <attribute name="CacheMode">REPL_ASYNC</attribute>

  <!--  Whether each interceptor should have an mbean
registered to capture and display its statistics.  -->
  <attribute name="UseInterceptorMbeans">true</attribute>

  <!-- Name of cluster. Needs to be the same for all clusters, in order
to find each other -->
  <attribute name="ClusterName">Cache-Cluster</attribute>

  <attribute name="ClusterConfig">
    <config>
      <!-- UDP: if you have a multihomed machine,
              set the bind_addr attribute to the appropriate NIC IP address
      -->
      <!-- UDP: On Windows machines, because of the media sense feature
               being broken with multicast (even after disabling media sense)
               set the loopback attribute to true
      -->
      <UDP mcast_addr="228.1.2.3" mcast_port="45566" ip_ttl="64" ip_mcast="true"
           mcast_send_buf_size="150000" mcast_recv_buf_size="80000" ucast_send_buf_size="150000"
           ucast_recv_buf_size="80000" loopback="false"/>
      <PING timeout="2000" num_initial_members="3" up_thread="false" down_thread="false"/>
      <MERGE2 min_interval="10000" max_interval="20000"/>
      <FD shun="true" up_thread="true" down_thread="true"/>
      <VERIFY_SUSPECT timeout="1500" up_thread="false" down_thread="false"/>
      <pbcast.NAKACK gc_lag="50" max_xmit_size="8192" retransmit_timeout="600,1200,2400,4800" up_thread="false"
                     down_thread="false"/>
      <UNICAST timeout="600,1200,2400" window_size="100" min_threshold="10" down_thread="false"/>
      <pbcast.STABLE desired_avg_gossip="20000" up_thread="false" down_thread="false"/>
      <FRAG frag_size="8192" down_thread="false" up_thread="false"/>
      <pbcast.GMS join_timeout="5000" join_retry_timeout="2000" shun="true" print_local_addr="true"/>
      <pbcast.STATE_TRANSFER up_thread="false" down_thread="false"/>
    </config>
  </attribute>

  <!--    The max amount of time (in milliseconds) we wait until the
          initial state (ie. the contents of the cache) are retrieved from
          existing members in a clustered environment
  -->
  <attribute name="InitialStateRetrievalTimeout">5000</attribute>

  <!--    Number of milliseconds to wait until all responses for a
          synchronous call have been received.
  -->
  <attribute name="SyncReplTimeout">10000</attribute>

  <!--  Max number of milliseconds to wait for a lock acquisition -->
  <attribute name="LockAcquisitionTimeout">15000</attribute>

  <!--  Name of the eviction policy class. -->
  <attribute name="EvictionPolicyClass">org.jboss.cache.eviction.LRUPolicy</attribute>

  <!--  Specific eviction policy configurations. This is LRU -->
  <attribute name="EvictionPolicyConfig">
    <config>
      <attribute name="wakeUpIntervalSeconds">5</attribute>
      <!--  Cache wide default -->
      <region name="/_default_">
        <attribute name="maxNodes">5000</attribute>
        <attribute name="timeToLiveSeconds">1000</attribute>
        <!-- Maximum time an object is kept in cache regardless of idle time -->
        <attribute name="maxAgeSeconds">120</attribute>
      </region>

      <region name="/org/jboss/data">
        <attribute name="maxNodes">5000</attribute>
        <attribute name="timeToLiveSeconds">1000</attribute>
      </region>

      <region name="/org/jboss/test/data">
        <attribute name="maxNodes">5</attribute>
        <attribute name="timeToLiveSeconds">4</attribute>
      </region>
    </config>
  </attribute>

  <!-- New 1.3.x cache loader config block -->
  <attribute name="CacheLoaderConfiguration">
    <config>
      <!-- if passivation is true, only the first cache loader is used; the rest are ignored -->
      <passivation>false</passivation>
      <!-- <preload>/a/b, /allTempObjects, /some/specific/fqn</preload> -->
      <shared>false</shared>

      <!-- we can now have multiple cache loaders, which get chained
      <cacheloader>
          <class>org.jboss.cache.loader.FileCacheLoader</class>
          <properties>
              location=/tmp/cacheFileStore
          </properties>
          <async>false</async>
          <fetchPersistentState>true</fetchPersistentState>
          <ignoreModifications>false</ignoreModifications>
          <purgeOnStartup>false</purgeOnStartup>
      </cacheloader>
      -->

      <cacheloader>
        <class>org.jboss.cache.loader.JDBCCacheLoader</class>
        <properties>
          cache.jdbc.table.name=jbosscache
          cache.jdbc.table.create=true
          cache.jdbc.table.drop=true
          cache.jdbc.table.primarykey=jbosscache_pk
          cache.jdbc.fqn.column=fqn
          cache.jdbc.fqn.type=varchar(255)
          cache.jdbc.node.column=node
          cache.jdbc.node.type=blob
          cache.jdbc.parent.column=parent
          cache.jdbc.driver=oracle.jdbc.driver.OracleDriver
          cache.jdbc.url=jdbc:oracle:thin:@[hostname]:1521:orcl
          cache.jdbc.user=[username]
          cache.jdbc.password=[password]
        </properties>
        <async>true</async>
        <fetchPersistentState>false</fetchPersistentState>
        <ignoreModifications>false</ignoreModifications>
        <purgeOnStartup>false</purgeOnStartup>
      </cacheloader>
    </config>
  </attribute>
</mbean>
Then package this file into a SAR archive (which is a ZIP essentially, only with a different extension) with the following structure:
jbosscache.sar/
   - META-INF/
      - jboss-service.xml
You have to package the SAR at your EAR's root level and add the following lines in your META-INF/jboss-app.xml:
<module>
   <service>jbosscache.sar</service>
</module>
Should you encounter any serialization problems during startup or later use, you can switch back from JBoss serialization to standard Java serialization by adding the following JVM option:
-Dserialization.jboss=false
Your application should depend on the following artifacts in order to be able to use JBoss Cache as its cache provider (assuming you use Maven for building):
<dependencies>
  <dependency>
    <groupId>org.jboss.cluster</groupId>
    <artifactId>hibernate-jbc-cacheprovider</artifactId>
    <version>1.0.1.GA</version>
    <exclusions>
      <exclusion>
        <groupId>hibernate</groupId>
        <artifactId>hibernate3</artifactId>
      </exclusion>
      <exclusion>
        <groupId>jboss</groupId>
        <artifactId>jboss-common</artifactId>
      </exclusion>
      <exclusion>
        <groupId>jboss</groupId>
        <artifactId>jboss-jmx</artifactId>
      </exclusion>
      <exclusion>
        <groupId>jboss</groupId>
        <artifactId>jboss-system</artifactId>
      </exclusion>
      <exclusion>
        <groupId>jboss</groupId>
        <artifactId>jboss-j2ee</artifactId>
      </exclusion>
      <exclusion>
        <groupId>jboss</groupId>
        <artifactId>jboss-transaction</artifactId>
      </exclusion>
    </exclusions>
  </dependency>
  <dependency>
    <groupId>org.hibernate</groupId>
    <artifactId>hibernate-jbosscache</artifactId>
    <version>3.3.1.GA</version>
    <exclusions>
      <exclusion>
        <groupId>jboss</groupId>
        <artifactId>jboss-cache</artifactId>
      </exclusion>
      <exclusion>
        <groupId>jboss</groupId>
        <artifactId>jboss-system</artifactId>
      </exclusion>
      <exclusion>
        <groupId>jboss</groupId>
        <artifactId>jboss-common</artifactId>
      </exclusion>
      <exclusion>
        <groupId>jboss</groupId>
        <artifactId>jboss-minimal</artifactId>
      </exclusion>
      <exclusion>
        <groupId>jboss</groupId>
        <artifactId>jboss-j2se</artifactId>
      </exclusion>
      <exclusion>
        <groupId>concurrent</groupId>
        <artifactId>concurrent</artifactId>
      </exclusion>
      <exclusion>
        <groupId>jgroups</groupId>
        <artifactId>jgroups-all</artifactId>
      </exclusion>
    </exclusions>
  </dependency>
</dependencies>
Note: the exclusions are here to prevent version mismatches with the libraries already included in our project or provided by JBoss itself. You may have to adjust them manually for your application.
If you don't use Maven, you have to download the mentioned libraries manually and include them on your classpath.
Now it's time to let Hibernate know something about our cache. A few options is more than enough:
hibernate.cache.provider_class=org.jboss.hibernate.jbc.cacheprovider.JmxBoundTreeCacheProvider
hibernate.treecache.mbean.object_name=jboss.cache:service=TreeCache
hibernate.cache.use_second_level_cache=true
hibernate.cache.use_query_cache=false
hibernate.transaction.manager_lookup_class=<your_transaction_manager_class>
Having done all this, you can cache your entity classes by marking them with the @Cache annotation. Remember that only read-only and transactional strategies are supported by clustered TreeCache.
Your newly created cache can be monitored in two ways - via Hibernate statistics module or via TreeCache JMX MBean, which we have already created.
To use Hibernate statistics, an additional dependency is needed in your POM:
<dependency>
    <groupId>org.hibernate</groupId>
    <artifactId>hibernate-jmx</artifactId>
    <version>3.3.1.GA</version>
</dependency>
In order to enable statistic gathering and exporting, the following has to be put in your Spring context file:
<bean id="jmxExporter"
      class="org.springframework.jmx.export.MBeanExporter">
  <property name="beans">
    <map>
      <entry key="Hibernate:name=statistics">
        <ref local="statisticsBean"/>
      </entry>
    </map>
  </property>
</bean>

<bean id="statisticsBean" class="org.hibernate.jmx.StatisticsService">
<property name="statisticsEnabled">
  <value>true</value>
</property>
<property name="sessionFactory">
  <ref local="hibernateSessionFactory"/>
</property>
</bean>
where "hibernateSessionFactory " is the ID of session factory Spring bean. With this change, Hibernate statistics module is available via JMX.
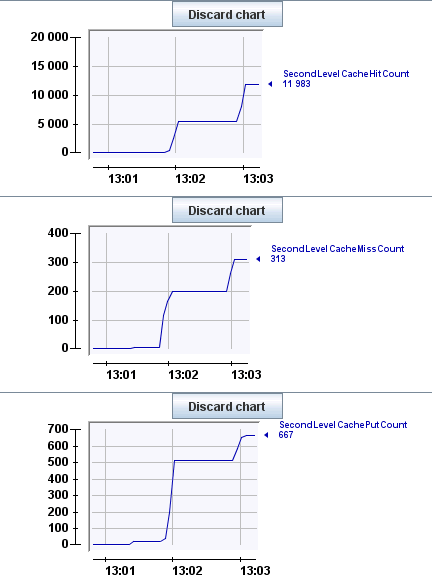
You can monitor cached entity Fully Qualified Names (labelled Second level cache regions) and the ratio of put, hit and miss counts to verify that the cache is working as expected. Correctly cached jBPM after a while of operating should result in a very high hit/miss ratio, such as on this screenshot from JConsole:
Tuning jBPM performance
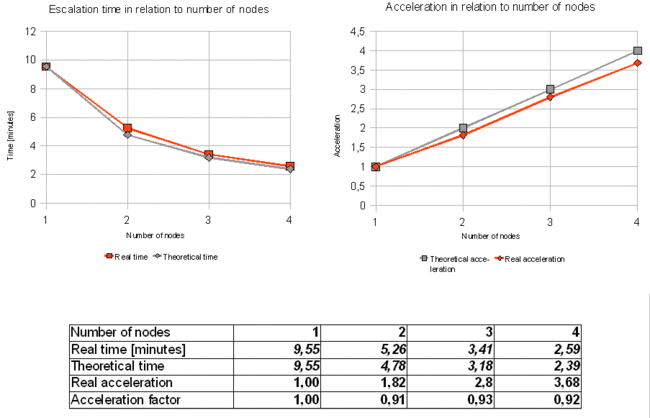
jBPM in a default configuration scales well but provides only a fraction of its potential performance. The following graph shows how the escalation times fall with addition of subsequent nodes. Scenario which I tested consists of 1000 Calls, each automatically escalated twice – which results in 2000 total escalations. Each escalation results in a database update. All results are illustrative and subject to some fluctuation under different testing conditions.
We are seeking to achieve near-linear scalability. Linear scalability, relative to server resources, means that with a constant load, performance improves at a constant rate relative to additional resources.
The left chart shows comparison of real escalation time to theoretical time, based on linear acceleration. The right chart compares real acceleration to theoretical linear acceleration.
These results were collected using standard jBPM configuration – 1 JobExecutor thread, 10 second idleInterval, 1 hour maxIdleInterval and are meant to show only how jBPM scales in its default setup. It's not bad but the acceleration factor could be higher.
Now, let's play with the configuration a little. jBPM has two options named idleInterval and maxIdleInterval which are of interest to us. When an Exception is thrown by the JobExecutor, it pauses for a period defined in idleInterval, which is then increased twofold until it reaches maxIdleInterval . Unfortunately for us, StaleObjectStateException is thrown each time an optimistic locking clash is detected, and this happens quite often with many concurrent JobExecutors trying to acquire a job. Reducing both values is crucial in order to achieve a high concurrency rate. Here are the results of reducing idleInterval to 500 milliseconds and maxIdleInterval to 1000 milliseconds:
The left chart shows comparison of real escalation time to theoretical time, based on linear acceleration. The right chart compares real acceleration to theoretical linear acceleration.
You can see that the acceleration curve is very close to the optimum now. Let's see if we can shift the whole time curve downwards.
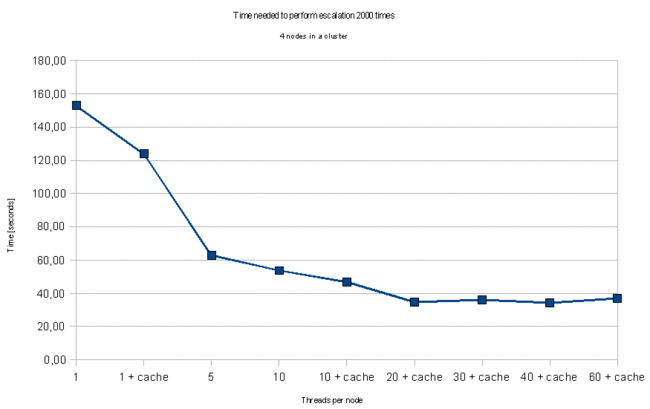
In order to increase throughput of the workflow engine you can change the number of JobExecutor threads per machine. I have performed the same performance tests as previously but this time on 4 nodes only, increasing the number of threads and experimenting with cache on or off. Caching increased the throughput by 15-23%, but the most significant gain comes from increasing the thread number:
This finally got us some real high performance. Increasing the thread number to 20 together with enabling cache skyrocketed the throughput by 340% in comparison to standard configuration.
We can see that at 20 threads per machine we have reached the saturation point, increasing this value further does not yield significantly better results. Caching would probably bring even more light into the picture if the database was under constant load from other parts of the application.
Conclusion
You have seen a thorough study of jBPM clustering and tuning. The verdict is that jBPM is a very efficient workflow engine, it only requires turning the right knobs in order to get the most out of it. By adding 3 servers and tweaking jBPM configuration, we were able to increase the throughput over 16 times in comparison to 1 server environment with default setup. If you need to increase the throughput of your workflow, I suggest you take the following order of modifications:
- increase the number of JobExecutor threads
- add cache to decrease database load
- add more servers as necessary
One thing is to be remembered though – database will always be a bottleneck at some point in time. After all, jBPM is mostly based on Hibernate. Therefore, if your efforts don't bring expected results, think about tuning / clustering your DB.
Links
- Sun's documentation on InetAddress.getLocalHost() issues: http://bugs.sun.com/bugdatabase/view_bug.do?bug_id=4665037
- JBoss clustering HOWTO: http://docs.jboss.org/jbossas/jboss4guide/r4/html/cluster.chapt.html
- jBPM user guide – caching: http://docs.jboss.com/jbpm/v3.2/userguide/html_single/#secondlevelcache
- Hibernate second-level cache: http://www.hibernate.org/hib_docs/reference/en/html/performance-cache.html
- TreeCache reference: http://www.jboss.org/file-access/default/members/jbosscache/freezone/docs/1.4.0/TreeCache/en/html_single/index.html#d0e2066
- JBoss Cache configuration options: http://www.jboss.org/community/docs/DOC-10265
- Hibernate JBossCache provider: http://www.jboss.org/community/docs/DOC-12948
Library versions
jBPM-jPDL: 3.2.2
Hibernate: 3.3.1
JBoss: 4.2.3GA
TreeCache: 1.4.1SP9
Hibernate JBossCache provider: 1.0.1GA
About the author
Szymon Zeslawski currently works as Senior Developer for Consol Consulting & Solutions, developing cutting edge business solutions. Graduated from AGH Technical University in Krakow, Poland, he devoted his technical side of life to Java since 2002. His areas of expertise, gathered during 3 years of professional experience, cover various web, mobile and enterprise technologies with focus on ergonomy and performance. When not at computer, he stretches his mind and body training Chuo Jiao or chases ghosts from behind the steering wheel.


