Benchmark Analysis: Guice1.0 vs Spring2.5
At the weekend I managed to get some free time away from working on our next release to look at a recent benchmark that compared the performance of Google Guice 1.0 with Spring 2.5. The benchmark referred to in the article as a modified version of Crazy Bob’s “Semi Useless” Benchmark is interesting not in terms of the results but in the analysis of the results and test construction. After reviewing the findings and benchmark code I thought it would be a good idea to instrument particular parts in the code with our Probes resource metering framework to better understand some peculiarities reported and to show how I use JXInsight Probes myself.
What follows is the typical process steps I perform when investigating a probable performance issue with a code base that I am largely unfamiliar with. During this process I highlight possible pitfalls in creating a benchmark as well in the analysis of results when related to concurrency, GC and memory allocation. Very importantly is that the conclusions of this process are different from those posted on the benchmark blog
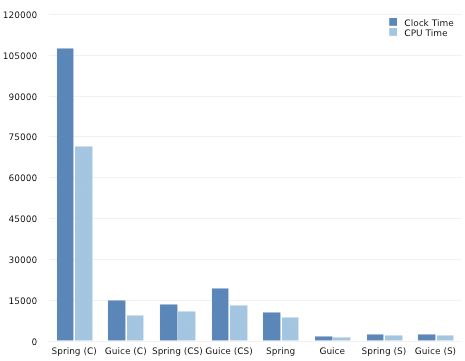
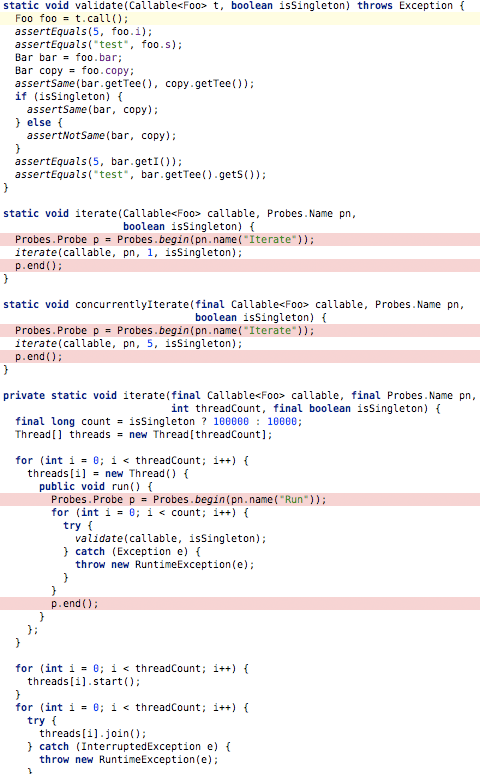
In the benchmark there are 2 basic parameters with 4 possible combinations for each technology benchmarked. The first parameter indicates whether the test is to be executed concurrently (5 threads). The second parameter indicates whether a singleton factory is used. It is important to note that in the benchmark the number of calls made by one or more threads is dependent on the value of the singleton parameter (see first line in iterate(..) method). Below are the results from my own benchmarking on a Mac PowerBook G4 for each of the four possible combinations per technology.
 (C) Concurrent
 (CS)Concurrent + Singleton
 (S) Singleton
 ( ) Non-Concurrent + Non-Singleton
After being surprised by the large difference in the concurrent tests with a non-singleton factory (Guice is much faster than Spring) I was intrigued by the closeness of the singleton tests across technologies especially as the Guice concurrent test run for the singleton instance was much slower than its concurrent test run for the non-singleton factory even after taking into account the increase (x10) in number of validate(...) method calls. Time for some basic instrumentation to better explain the results.
Below I have highlighted the main changes I made to the benchmark code to capture the resource consumption across the two different executing thread workers using our open Probes API.
I ran both the Guice and Spring tests separately to ensure that neither impacted the others results. I then merged each of the probes snapshot that were automatically exported at the end of each test run. Here is the jxinsight.override.config properties file used for my first set of tests.
 jxinsight.server.profiler.autostart=false
 jxinsight.server.agent.events.gc.enabled=false
 # new system property in 5.5.EA.16
 jxinsight.server.probes.highprecision.enabled=true
 jxinsight.server.probes.meter.clock.time.include=true
 jxinsight.server.probes.meter.cpu.time.include=true
 jxinsight.server.probes.meter.blocking.time.include=true
 jxinsight.server.probes.meter.waiting.time.include=true
 jxinsight.server.probes.meter.jmgmt.gc.time.include=true
 jxinsight.server.probes.meter.jmgmt.gc.count.include=true
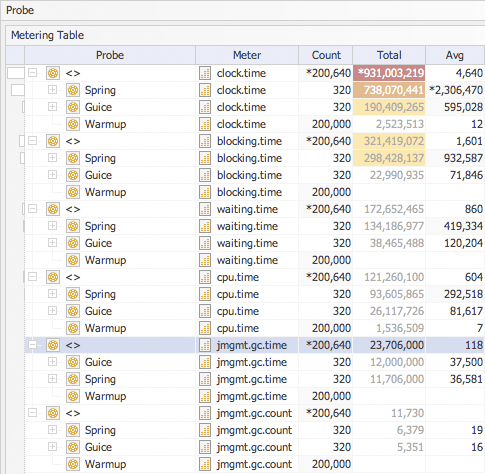
The high level metering results are shown below with times reported in microseconds and the data sorted by total. Note the general ordering of technologies changes within one particular meter.
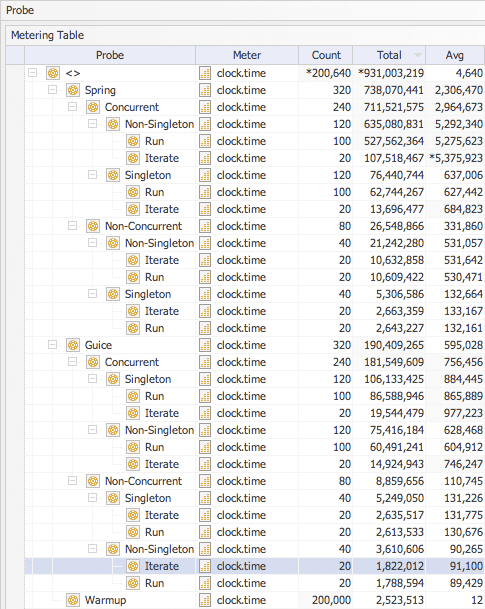
The table below shows the wall clock times for each technology and for each parameter combination. What immediately struck me about the data was the change in ordering of singleton and non-singleton tests across Spring and Guice. With Guice the singleton tests were always slower than the non-singleton tests which is the complete opposite to Spring and what you would expect. I then noticed that this difference was much more prominent when executed concurrently. Spring (CS) was 13.696 seconds compared with Guice’s (CS) 19.544 seconds - approximately a 6 second difference.
When comparing across concurrent tests I used the Iterate probe group because the wall clock is a global meter and hence is multiplied by the number of concurrent (aggregating) threads firing probes.
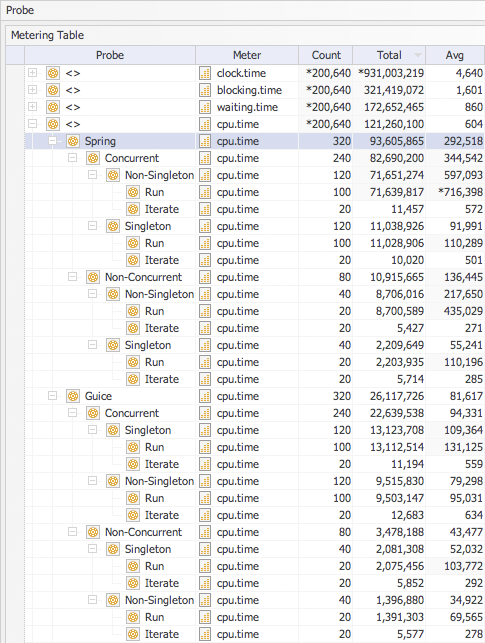
Analysis of the CPU metering data also revealed the same strange difference in test ordering across technologies when the table was sorted by the Total column. Because CPU is a thread specific meter I looked at the totals for the Run probe group. Spring (CS) was 11.028 seconds compared with Guice’s (CS) 13.112 seconds - approximately 2 seconds in the difference but not 6 seconds. Could this be a clue? Well not necessarily because the CPU times for Spring (S) and Guice (S) were reversed though somewhat closer - 2.203 seconds compared to 2.075 seconds respectively. It would appear from this that Guice trades additional CPU processing with a reduction in thread monitor contention.
When I first looked at the following table I noticed that the difference in ordering between the non-singleton to singleton tests across technologies had disappeared - both Spring and Guice had non-singleton listed first under concurrent testing and the reversed order when executing tests with one thread.
Then I noticed the high blocking time of 9.248 seconds when executing Guice (CS) tests compared 0.054 seconds for the same test using Spring. To have such high blocking times the software needs to be executing a relatively expensive (in terms of this micro-benchmark) operation within a synchronized block that is called with a high degree of concurrency (multiple threads). But this is a singleton test what could that expensive operation be once the singleton has been created?
I was now extremely curious about what would be the final conclusion so I skipped the waiting time meter as this would only report on the Thread.join() method calls used to determine the end of the concurrent tests runs.
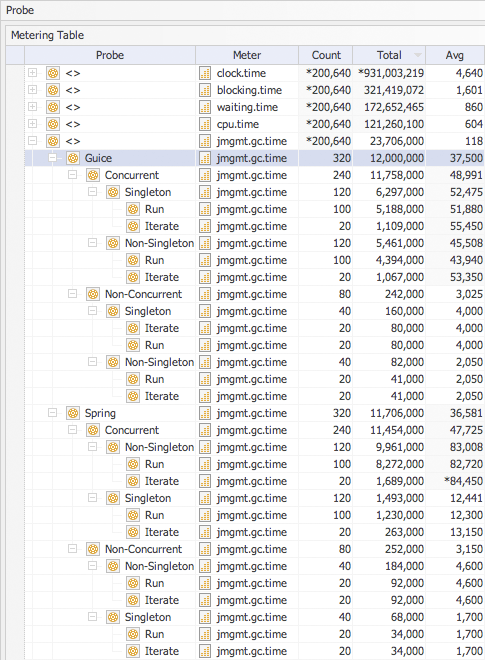
The garbage collection (GC) time meter always has a tale to tell about the software execution model and this time around it was to be no different. My first observation was that Guice placed before Spring within this particular meter. But on closer examination I could see that this was largely a result of the aggregation of GC times for singleton tests (are the alarm bells ringing). Guice appeared to be more efficient, in terms of object allocation, when executing non-singleton tests than when executing singleton tests. Surely this is not correct? It is not correct (at least not completely) and there is a clue in the Spring metering data - object allocation (how else would we have GC) always occurs even when using a singleton factory.
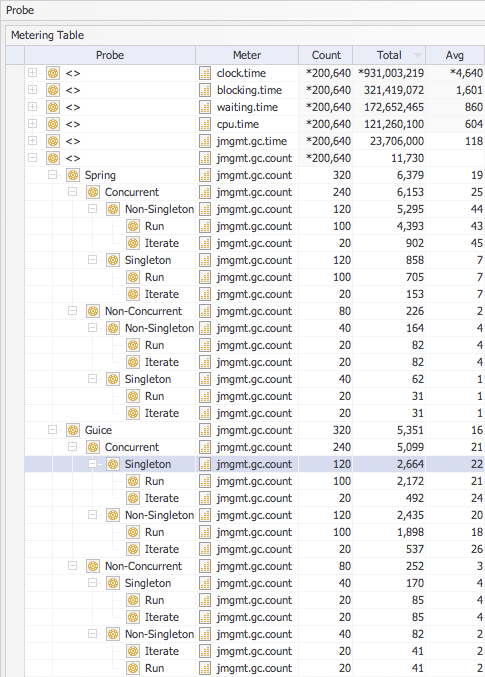
The next meter I looked at is the number of times GC occurs during each test run using the value of the total for the Iterate probe group because GC like wall clock time is a global meter and thus is duplicated (correctly) in the Run probe group totals. After looking at the GC times in the table above you might be expecting that the ordering of the technology stack to be the same but it is not! Does this tell me something? That GC is more efficient (shorter cycles) when cleaning up objects created by Spring?
At this stage I had enough information to formulate an educated guess for the cause of the performance degradation when executing singleton tests with Guice but there was still something not right about the data. I decided to re-run my tests but this time turning off all timing metrics and focusing on object allocation. Here are the system properties used in the jxinsight.override.config file.
 jxinsight.server.profiler.autostart=false
 jxinsight.server.agent.events.gc.enabled=false
 jxinsight.server.agent.events.alloc.enabled=true
 jxinsight.server.probes.highprecision.enabled=true
 jxinsight.server.probes.meter.alloc.bytes.include=true
 jxinsight.server.probes.meter.clock.time.include=false
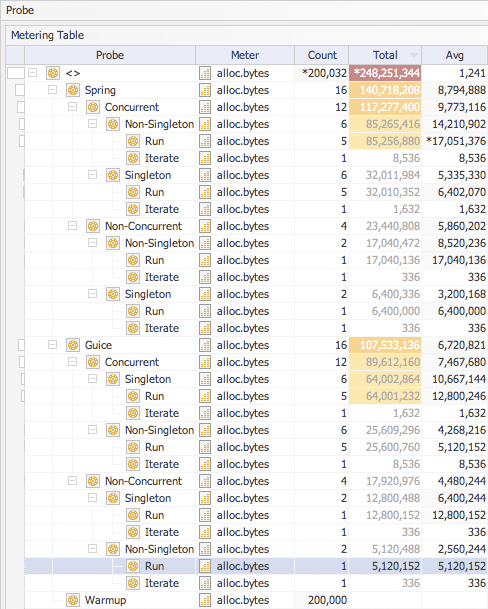
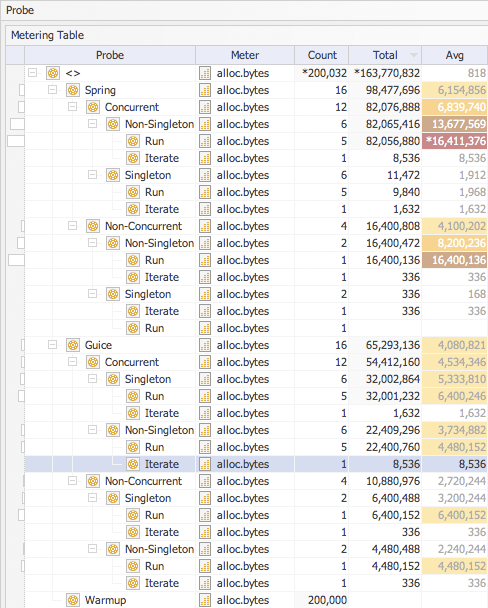
The test data did confirm the first part of my guess that the underlying cause was related to an increased level of object allocation. (The second part was that this allocation occurred in a synchronized block which would explain why the difference was more pronounce in the concurrent tests.) The Guice singleton tests had not only higher values than the same tests under Spring but more significantly they were higher than the Guice non-singleton tests. But why did the Spring numbers for singleton tests look still too high? I decided to take another look at the validate(...) method and the out bound calls. This time I was looking for a method that might inadvertently create objects. I found the culprit. The JUnit assertEquals(int,int) creates two Integers before calling Object.equals(Object).
Here are the revised figures after replacing the Assert.assertEquals(int, int) method with an implementation that does not create any Integer objects. The Spring results now looked inline with what we would expect from a single factory - an object instance created for each additional concurrent thread.
The above figures for the Guice singleton tests had decreased by approximately 50% but there was still object allocation occurring. This called for more in-depth resource metering analysis of the Google Guice codebase.
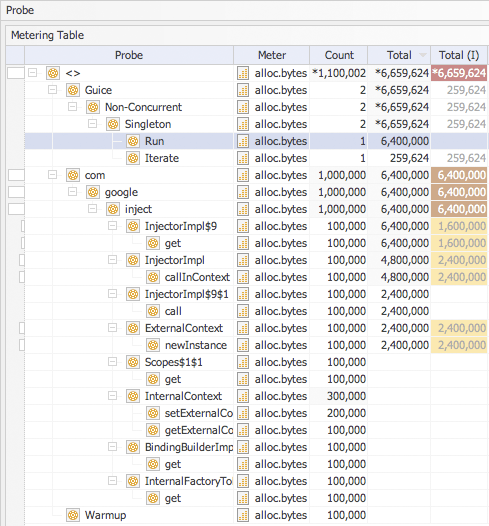
Here is the metering data collected after load-time weaving in our Probes aspect library into the runtime. I have included the Total (Inherent) column in this screen shot to point out the actual object allocation cost centers and call delegation (Hint: 6,400,000 - 1,600,000 = 4,800,000 and 4,800,00 - 2,400,000 = 2,400,000).
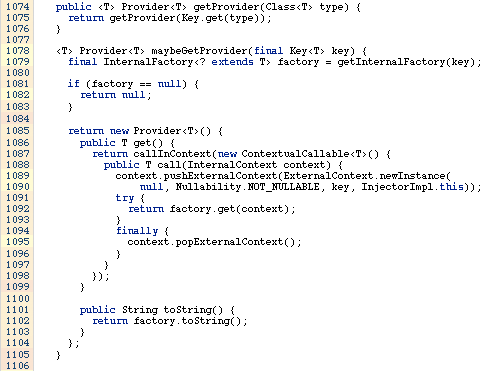
Here is the related code snippet extracted from Google Code showing the actual object allocation calls.
Discuss this article with William
原文link: http://www.javalobby.org/articles/guice-vs-spring/