Highcharts 3.0.8功能特性使用评测

一、向下钻取功能

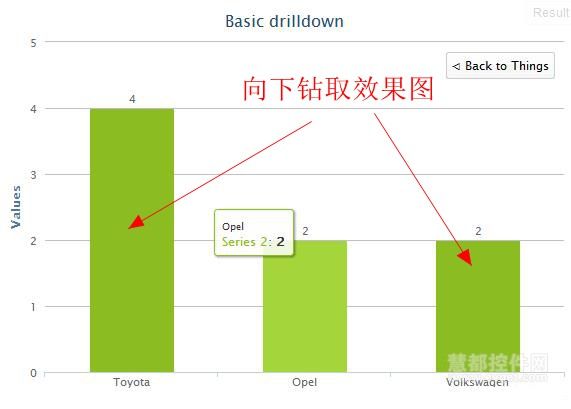
Highcharts 3.0.8内建向下钻取功能。在drilldown.series数组中,为点进行向下钻取设置就可以实现。

基本设置

基本设置中向下钻取定义在 drilldown设置下的一个独立的数组中。每一个设置都会被分配ID,这样我们可以使用它们为钻取的点进行识别。

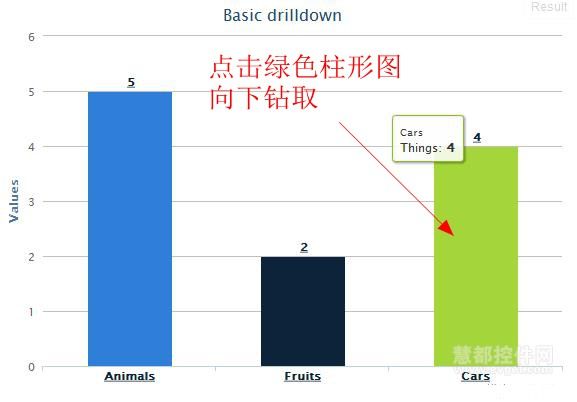
效果图:

Highcharts 3.0.8向下钻取

向下钻取:

Highcharts 3.0.8向下钻取

代码:

series: [{
            name: 'Things',
            colorByPoint: true,
            data: [{
                name: 'Animals',
                y: 5,
                drilldown: 'animals'
            }, {
                name: 'Fruits',
                y: 2,
                drilldown: 'fruits'
            }, {
                name: 'Cars',
                y: 4,
                drilldown: 'cars'
            }]
        }],
        drilldown: {
            series: [{
                id: 'animals',
                data: [
                    ['Cats', 4],
                    ['Dogs', 2],
                    ['Cows', 1],
                    ['Sheep', 2],
                    ['Pigs', 1]
                ]
            }, {
                id: 'fruits',
                data: [
                    ['Apples', 4],
                    ['Oranges', 2]
                ]
            }, {
                id: 'cars',
                data: [
                    ['Toyota', 4],
                    ['Opel', 2],
                    ['Volkswagen', 2]
                ]
            }]
        }

异步设置

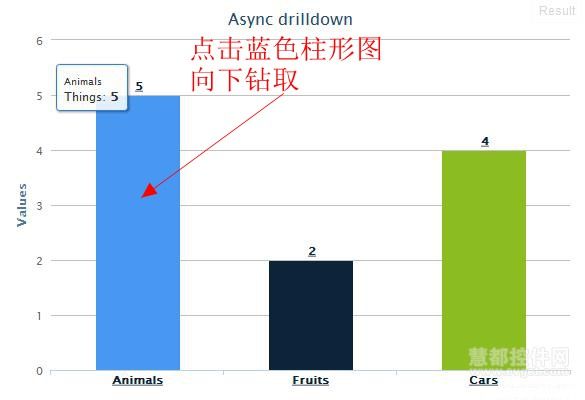
在修多情况下,我们都会想要其自动加载钻取内容。设置 point.drilldown 为true,并使用图表向下钻取选项加载基于点击点的钻取设置。当数据展现,我们在呼出Chart.addSeriesAsDrilldown方式。

效果图:

Highcharts 3.0.8向下钻取

对上图中数据进行向下钻取

Highcharts 3.0.8向下钻取

代码:

$(function () {    

    // Create the chart
    $('#container').highcharts({
        chart: {
            type: 'column',
            events: {
                drilldown: function (e) {
                    if (!e.seriesOptions) {
                        
                        var chart = this,
                            drilldowns = {
                                'Animals': {
                                    name: 'Animals',
                                    data: [
                                        ['Cows', 2],
                                        ['Sheep', 3]
                                    ]
                                },
                                'Fruits': {
                                    name: 'Fruits',
                                    data: [
                                        ['Apples', 5],
                                        ['Oranges', 7],
                                        ['Bananas', 2]
                                    ]
                                },
                                'Cars': {
                                    name: 'Cars',
                                    data: [
                                        ['Toyota', 1],
                                        ['Volkswagen', 2],
                                        ['Opel', 5]
                                    ]
                                }
                            },
                            series = drilldowns[e.point.name];
                        
                        // Show the loading label
                        chart.showLoading('Simulating Ajax ...');

                        setTimeout(function () {
                            chart.hideLoading();
                            chart.addSeriesAsDrilldown(e.point, series);
                        }, 1000);
                    }

                }
            }
        },
        title: {
            text: 'Async drilldown'
        },
        xAxis: {
            type: 'category'
        },

        legend: {
            enabled: false
        },

        plotOptions: {
            series: {
                borderWidth: 0,
                dataLabels: {
                    enabled: true,
                }
            }
        },

        series: [{
            name: 'Things',
            colorByPoint: true,
            data: [{
                name: 'Animals',
                y: 5,
                drilldown: true
            }, {
                name: 'Fruits',
                y: 2,
                drilldown: true
            }, {
                name: 'Cars',
                y: 4,
                drilldown: true
            }]
        }],

        drilldown: {
            series: []
        }
    })
});

二、显示No data to display

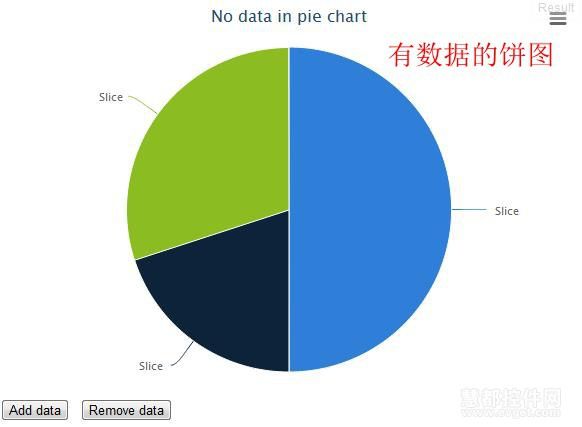
有数据情况效果图:

Highcharts 3.0.8显示No data to display

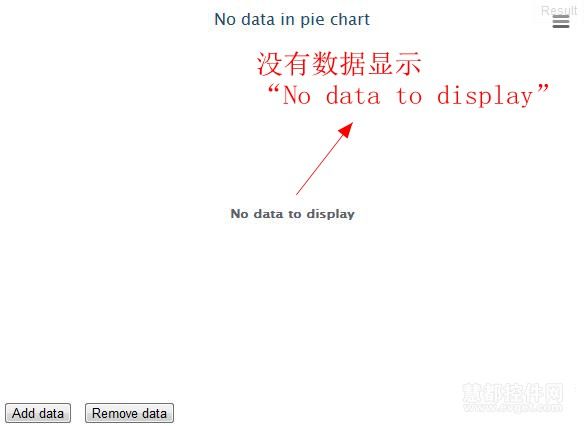
无数显示No data to display

Highcharts 3.0.8显示No data to display

代码:

$(function () {

    var chart,
        btnRemove = $('#remove'),
        btnAdd = $('#add');

    btnAdd.click(function () {       
        chart.series[0].addPoint(Math.floor(Math.random() * 10 + 1)); // Return random integer between 1 and 10. 
    });

    btnRemove.click(function () {     
        if(chart.series[0].points[0]) {
            chart.series[0].points[0].remove();
        }
    });

    $('#container').highcharts({
        chart: {
            plotBackgroundColor: null,
            plotBorderWidth: null,
            plotShadow: false
        },
        title: {
            text: 'No data in pie chart'
        },
        series: [{
            type: 'pie',
            name: 'Random data',  
            data: []     
        }]
    });

    chart = $('#container').highcharts();
});

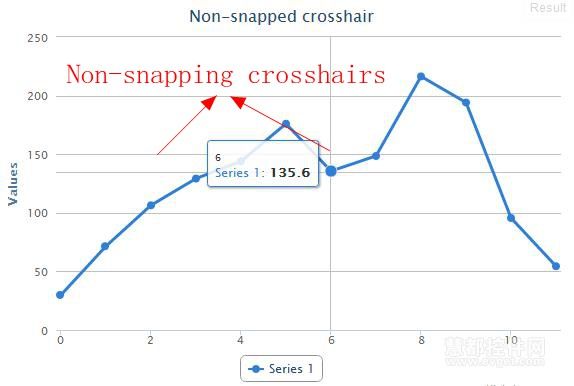
三、Non-snapping crosshairs

效果图:

Highcharts 3.0.8显示Non-snapping crosshairs

代码:

$(function () {
    $('#container').highcharts({
    	title: {
    			text: 'Non-snapped crosshair'
    	},
    	xAxis: {
            crosshair: {
                snap: false
            }
        },
        yAxis: {
            crosshair: {
                snap: false
            }
        },
        series: [{
            data: [29.9, 71.5, 106.4, 129.2, 144.0, 176.0, 135.6, 148.5, 216.4, 194.1, 95.6, 54.4]
        }]
    });
});
你可能感兴趣的:(Highcharts,JavaScript图表,html5图表,Highcharts评测,Highcharts下载)