如何设置Highcharts刻度线
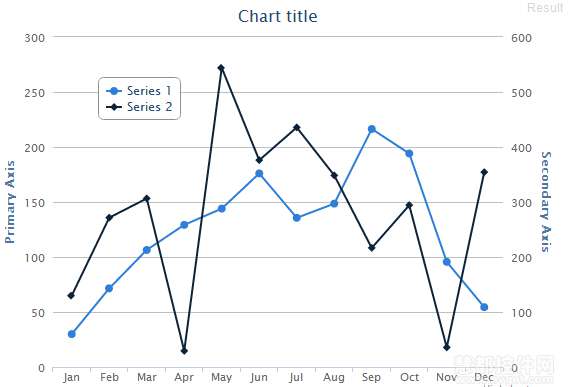
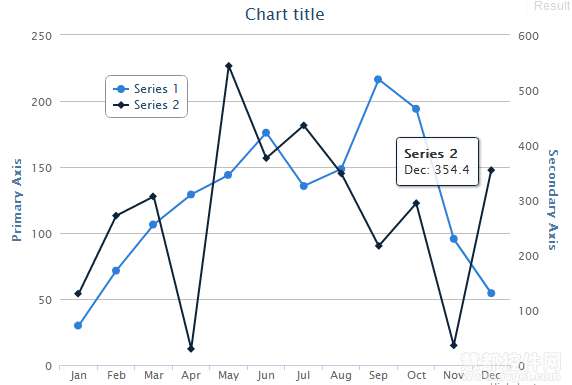
在Highcharts中,当使用多个轴线时,两个或两个以上相反轴的刻度将会自动添加到刻度线并且刻度线数最少。这个可以设置 alignTicks 为 false 来阻止。如果网格线显得零乱,这里有个方法来隐藏它们,就是设置 gridLineWidth 为 0。默认设置为 true。
操作一: alignTicks 默认设置为true
$(function () {
    $('#container').highcharts({
        chart: {
            //alignTicks: false,
            type: 'line'
        },
        xAxis: {
            categories: ['Jan', 'Feb', 'Mar', 'Apr', 'May', 'Jun', 'Jul', 'Aug', 'Sep', 'Oct', 'Nov', 'Dec']
        },
        yAxis: [{
            title: {
                text: 'Primary Axis'
            },
            gridLineWidth: 0
        }, {
            title: {
                text: 'Secondary Axis'
            },
            opposite: true
        }],
        legend: {
            layout: 'vertical',
            backgroundColor: '#FFFFFF',
            floating: true,
            align: 'left',
            x: 100,
            verticalAlign: 'top',
            y: 70
        },
        tooltip: {
            formatter: function() {
                return '
'+
                    this.x +': '+ this.y;
            }
        },
        plotOptions: {
        },
        series: [{
            data: [29.9, 71.5, 106.4, 129.2, 144.0, 176.0, 135.6, 148.5, 216.4, 194.1, 95.6, 54.4]

        }, {
            data: [129.9, 271.5, 306.4, 29.2, 544.0, 376.0, 435.6, 348.5, 216.4, 294.1, 35.6, 354.4],
            yAxis: 1

        }]
    });
});
操作二: alignTicks 设置为false
$(function () {
    $('#container').highcharts({
        chart: {
            alignTicks: false,
            type: 'line'
        },
        xAxis: {
            categories: ['Jan', 'Feb', 'Mar', 'Apr', 'May', 'Jun', 'Jul', 'Aug', 'Sep', 'Oct', 'Nov', 'Dec']
        },
        yAxis: [{
            title: {
                text: 'Primary Axis'
            }
        }, {
            title: {
                text: 'Secondary Axis'
            },
            gridLineWidth: 0,
            opposite: true
        }],
        legend: {
            layout: 'vertical',
            backgroundColor: '#FFFFFF',
            floating: true,
            align: 'left',
            x: 100,
            verticalAlign: 'top',
            y: 70
        },
        tooltip: {
            formatter: function() {
                return '

                '+
                    this.x +': '+ this.y;
            }
        },
        plotOptions: {
        },
        series: [{
            data: [29.9, 71.5, 106.4, 129.2, 144.0, 176.0, 135.6, 148.5, 216.4, 194.1, 95.6, 54.4]

        }, {
            data: [129.9, 271.5, 306.4, 29.2, 544.0, 376.0, 435.6, 348.5, 216.4, 294.1, 35.6, 354.4],
            yAxis: 1

        }]
    });
});
》》其他设置,查看原文

