Firebug Tutorial
Section 1: Console Tab : Logging, Profiling and CommandLine (Part II)
Introduction
This tutorial is the part II of “Firebug Tutorial – Logging, Profiling and CommandLine“. (If you haven’t read the part I of this tutorial, I would recommend you to read the part 1 first.)
The following topic will be covered in this section.
- Javascript Profiler
- Tracing error
- Tracing XmlHttpRequest object
#1. Javascript Profiler
Javascript Profiler is very useful feature of Firebug for measuring the execution time of each javascript code. It is useful for improving the performance of your code or if you wanna find out why a particular function takes soooo long. It is a bit similar to console.time() that I mentioned already to previous part but Javascript Profiler can give you more detailed information about what’s happening with your code.
There are three ways to use Javascript Profiler. You can call this function by clicking “Profile” button on the toolbar of Firebug console or through code “console.profile()” or by typing “profile()” in commandline. I will cover first two in this tutorial but not for using profile() in commandline. If you want to know how to use it in commandline, please check-out this article.
console.profile()
- Copy and paste the code in notepad and then, save as a htm file
<!DOCTYPE html PUBLIC "-//W3C//DTD XHTML 1.0 Transitional//EN" "http://www.w3.org/TR/xhtml1/DTD/xhtml1-transitional.dtd">
<html xmlns="http://www.w3.org/1999/xhtml" >
<head>
<title>Firebug</title>
<script language="javascript" type="text/javascript">
function startDoSomething(){
<strong>console.profile('Measuring time');</strong>
doSomething();
<strong>console.profileEnd();</strong>
}
function doSomething(){
doThis(1000);
doThis(100000);
doThat(10000);
doThisAndThat(1000,10000);
}
function doThis(count){
for(var i=0;i<count;i++){}
}
function doThat(count){
for(var i=0;i<count;i++){}
}
function doThisAndThat(countThis,countThat){
for(var i=0;i<countThis;i++){ for(var j=0;j<countThat;j++){} }
}
</script>
</head>
<body>
Open the console tab. Click the button below and wait a lit.. <br />
<input type="button" value="Start" onclick="startDoSomething();"/>
</body>
</html>
- Open this file in Firefox browser.
- Open the Console tab on Firebug console.
- Click “Start” button and wait a lit.. (You will get the result like the screenshot below. )
(The list is sorted based on the execution time.)
Columns and Description of Profiler
- Function column : It show the name of each function.
- Call column : It shows the count of how many a particular function has been invoked. (2 times for doThis() function in our case. )
- Percent column : It shows the time consuming of each function in percentage.
- Own Time column : It shows the duration of own script in a particular function. For example: doSomething() function has no its own code. Instead, it is just calling other functions. So, its own execution time will be 0ms as shown in picture. If you wanna see some values for that column, add some looping in this function.
- Time column : It shows the duration of execution from start point of a function to the end point of a function. For example: doSomething() has no code. So, its own execution time is 0 ms but we call other functions in that function. So, the total execution time of other functions is 923 ms. So, it shows 923 ms in that column. Not clear? Feel free to let me know. I can try once more.. I don’t mind to explain you again. (That’s my problem in writing .. I can’t write very clear.. Sorry about that. )
- Avg column : It shows the average execution time of a particular function. If you are calling a function one time only, you won’t see the differences. If you are calling more than one time, you will see the differences. Take a look the doThis() function at second line of picture above.
The formula for that column is ~
Avg = Own Ttime / Call; - Min column and Max column: It shows the minimum execution time of a particular function. In our example, we call doThis() function twice. When we passed 1000 as an parameter, it probably took only a few millisecond. (let’s say 1 ms.). then, we passed 100000 to that function again. It took much longer than first time. (let’s say 50 ms.) . So, in that case, “1 ms” will be shown in Min column and “50 ms” will be shown in Max column.
- File column : the file name of file where the function located.
Note: You can set the title of profiler by passing one string to console.profile() function. In our example (console.profile(‘Measuring time’);), ‘Measuring time’ is the title of profiler.
Profiler button from Console tab’s toolbar
If you don’t want to profile thru the code, you can use “Profile” button from the toolbar of Firebug console.
In order to test this,
- you need to remove two lines (console.profile(‘Measuring time’); and console.profileEnd();) from doSomething() function.
- Open this file in Firefox.
- Open Console tab of Firebug console.
- Click “Profile” button ( right button on the toolbar of Firebug console.)
- Click “Start” button on your page.
- Wait for 1 min ( or a lit less than that.)
- Click “Profile” button again. ( You will get the same graph as the picture above.)
That’s all about Javascript Profiler. Let me know if you have any question or comment.
Okay. Let’s move on to next topic.
#2. Options of Console tab
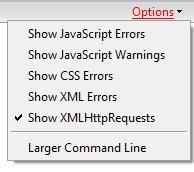
There is one link called “Options” at the right-side of Firebug console. If you click this link, you will see the menu as shown in picture below.
I will divided those times in three categories.
- Errors Tracing
- Show Javascript Error
- Show Javascript Warnings
- Show CSS Errors
- Show XML Errors
- XmlHttpRequest Tracing
- Show XMLHttpRequests
- CommandLine
- Larger Command Line
#2.1 Errors Tracing and Filtering
- Show Javascript Errors
- Show Javascript Warning
- Show CSS Errors
- Show XML Errors
Those options are used for tracing the errors of your script, style sheet and XML. You can also filter the error messages based on the type of error that you wanna.
Example Code
<!DOCTYPE html PUBLIC "-//W3C//DTD XHTML 1.0 Transitional//EN" "http://www.w3.org/TR/xhtml1/DTD/xhtml1-transitional.dtd">
<html xmlns="http://www.w3.org/1999/xhtml" >
<head>
<title>Firebug</title>
<style type="text/css">
.normalText{
bcolor : red;  /* This is ERROR!! */
}
</style>
<script language="javascript" type="text/javascript">
function foo(){
var objTxt = doucmnet.getElementById('nameTextBox');  //This is ERROR!!
alert(objTxt.value);
}
</script>
</head>
<body>

<input id="nameTextBox" class="normalText" type="text" />
<input type="button" value="Start" onclick="foo();"/>
</body>
</html>
Output ~
- Copy and paste the code in notepage.
- Save as a .htm file.
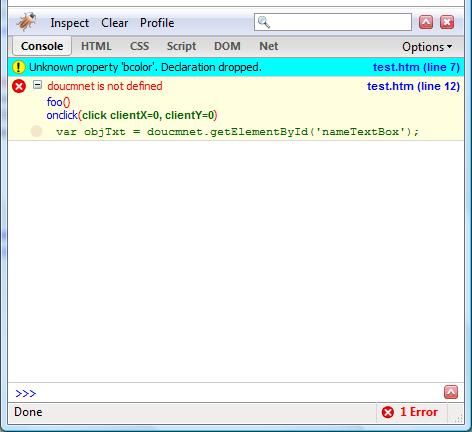
- Check “Shows Javascript errors” and “Shows CSS errors” on Console tab.
- Reload the page
- First, you will get the CSS error. ( Reason : We wrote bcolor instead of color in “normalText” class. )
- Click the button
- then, we will get the another error. ( because we wrote “doucmnet” instead of “document” in the code. )
I think those options are very sample to use. If you wanna see the errors, just check the option in menu. then, Firebug will give very good information about the errors that you are getting. Uncheck it if you don’t want.
#2.2. Tracing XmlHttpRequest object
This is also one of the most popular feature of Firebug and it is really helpful for Ajax developer. The problem with Ajax is that it is very difficult to figure out if something goes wrong in XmlHttpRequest. Sometimes, you have no idea about what’s going on behind the sense while the indicator keep on cycling all the time. One of the problem that I face when I was playing around with ajax, it is difficult to find out whether the response format from Web service are correct or not.
but things are very simple with Firebug. You only need to select “Show XmlHttpRequest” option. Firebug will tell the following thing.
- The execution time
- Parameters (QueryString)
- HTTP Header
- Response
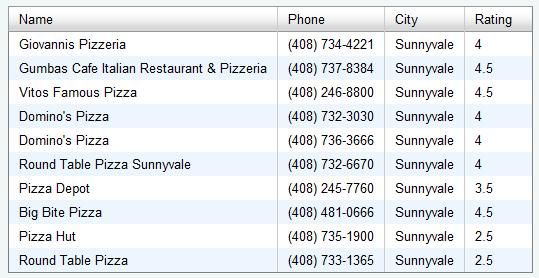
Example : I used Yahoo UI DataTable in this sample. This sample is the updated version of this sample from Yahoo UI.
Download : SourceCode
- Download the zip file from the link above
- Extract the zip file and put all files to PHP directory.
- Try to call this file “dt_xhrlocalxml_clean.html” from Firefox ( http://localhost/yui-php/dt_xhrlocalxml_clean.html in my case.)
- Open the Console tab in Firebug console.
- Select “Show XmlHttpRequests” option
- Click the button “Load Data” on the page
- The following result as shown in picture will be shown. (The style might be a lit bit different since I didn’t change the path in some CSS files. )
- And check the Console tab in Firebug console.
- You will the detailed response in XML format as shown in the picture below.
Note: If you don’t wanna download or if you don’t have PHP installed on your machine, you may try to check this online sample from Yahoo. But there won’t be any button so you should select the “Show XmlHttpRequests” option first and reload or open the link…
Okay. That’s all for today. I was thinking to write about CommandLine in this part but I don’t have the enough time to write it today. Don’t worry. I will tell about CommandLine tomorrow.
Cya. Don’t hesitate to drop a comment if you have any suggestion or comment. I appreciate it.


