使用Dstat监控Linux系统资源
本文来源于http://www.opendoc.com.cn/linuxtools/dstat.html
这里介绍一个新的监控工具------Dstat,你可以通过以下2种方法得到它的安装包或者压缩包
Wget http://rpmforge.sw.be/redhat/el5/en/i386/rpmforge/RPMS/dstat-0.6.7-1.el5.rf.noarch.rpm
wget http://dag.wieers.com/home-made/dstat/dstat-0.7.2.tar.bz2
安装好之后,我们来看看效果吧
[root@rep1 ~]# dstat
----total-cpu-usage---- -dsk/total- -net/total- ---paging-- ---system--
usr sys idl wai hiq siq| read writ| recv send| in out | int csw
0 0 100 0 0 0| 820B 33k| 0 0 | 0 0 | 488 960
0 2 98 0 0 0| 0 0 |2470B 678B| 0 0 | 473 894
0 0 100 0 0 0| 0 0 |1212B 576B| 0 0 | 480 935
0 0 100 0 0 0| 0 0 |1920B 576B| 0 0 | 498 959
0 0 100 0 0 0| 0 0 |2855B 630B| 0 0 | 497 956
0 2 98 0 0 0| 0 0 |1888B 576B| 0 0 | 491 929
0 0 100 0 0 0| 0 0 |2968B 576B| 0 0 | 482 925
0 0 100 0 0 0| 0 0 |2313B 560B| 0 0 | 495 957
0 2 98 0 0 0| 0 0 |4083B 682B| 0 0 | 499 957
0 0 100 0 0 0| 0 0 |1906B 576B| 0 0 | 497 948
默认他监控的系统的cpu,disk,net,paging,system,一秒钟收集一次,其实最具特色的是他的显示特色,呵呵,有点象那种显示股票的颜色,每一个分类的颜色都是不一样的,很容易分清每项内容。。。
怎么样,酷吧,这个截图,呵呵。。。
下面是一些常用命令:
常用命令
dstat -cndymlp -N total -D total 525 统计CPU,IO ,network,system load
dstat -cndymlp -N total -D total 525 统计CPU,IO ,network,system load
dstat -cdnsil -D hda -N eth1 统计网卡1的信息
dstat �Cvmstat 内存使用情况
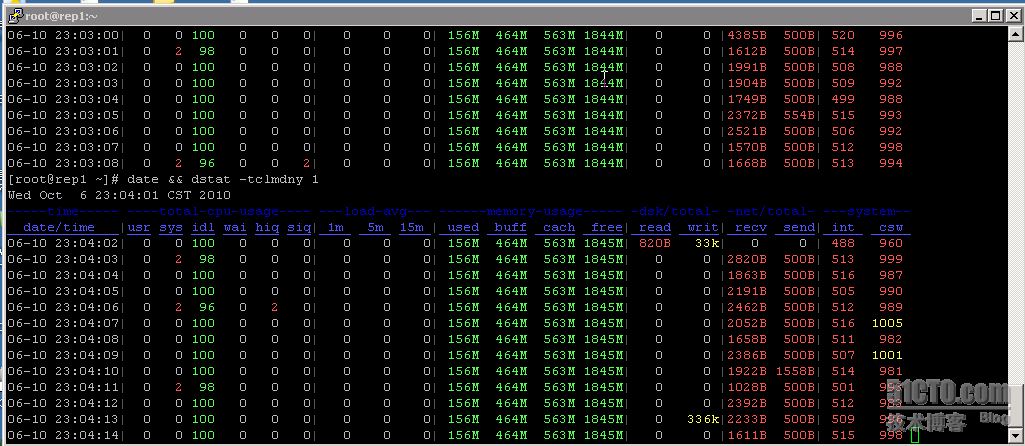
date && dstat -tclmdny 60
以下是Dstat的一些参数:
OPTIONS
-c, --cpu
enable cpu stats
-c, --cpu
enable cpu stats
-C 0,3,total
include cpu0, cpu3 and total
include cpu0, cpu3 and total
-d, --disk
enable disk stats
enable disk stats
-D total,hda
include hda and total
include hda and total
-g, --page
enable page stats
enable page stats
-i, --int
enable interrupt stats
enable interrupt stats
-I 5,10
include interrupt 5 and 10
include interrupt 5 and 10
-l, --load
enable load stats
enable load stats
-m, --mem
enable memory stats
enable memory stats
-n, --net
enable network stats
enable network stats
-N eth1,total
include eth1 and total
include eth1 and total
-p, --proc
enable process stats
enable process stats
-s, --swap
enable swap stats
enable swap stats
-S swap1,total
include swap1 and total
include swap1 and total
-t, --time
enable time/date output
enable time/date output
-T, --epoch
enable time counter (seconds since epoch)
enable time counter (seconds since epoch)
-y, --sys
enable system stats
enable system stats
--ipc enable ipc stats
--lock enable lock stats
--raw enable raw stats
--tcp enable tcp stats
--udp enable udp stats
--unix enable unix stats
-M stat1,stat2
enable internal stats and external plugin stats
enable internal stats and external plugin stats
Possible internal stats are
cpu, cpu24, disk, disk24, disk24old, epoch, int, int24, ipc, load, lock, mem, net, page, page24,
proc, raw, swap, swapold, sys, tcp, time, udp, unix
cpu, cpu24, disk, disk24, disk24old, epoch, int, int24, ipc, load, lock, mem, net, page, page24,
proc, raw, swap, swapold, sys, tcp, time, udp, unix
Possible external plugin stats can be listed using
dstat -M list
dstat -M list
-a, --all
equals -cdngy (default)
equals -cdngy (default)
-f, --full
expand -C, -D, -I, -N and -S discovery lists
expand -C, -D, -I, -N and -S discovery lists
-v, --vmstat
equals -pmgdsc -D total
equals -pmgdsc -D total
--integer
show integer values
show integer values
--nocolor
disable colors (implies --noupdate)
disable colors (implies --noupdate)
--noheaders
disable repetitive headers
disable repetitive headers
--noupdate
disable intermediate updates when delay > 1
disable intermediate updates when delay > 1
--output file
write CSV output to file
write CSV output to file
如果你想深入研究的话,你可以man下如果有心得,请共享下成果。。。