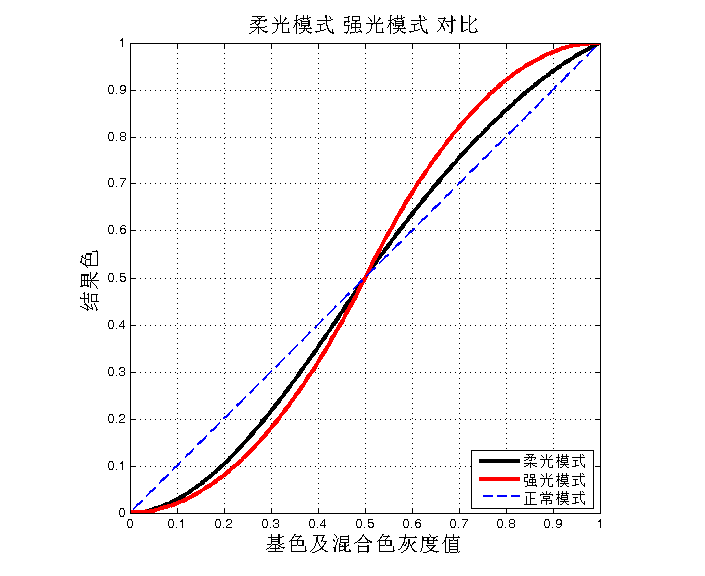
PhotoShop - 柔光模式与强光模式 的 响应曲线对比
从下图可以看出,当同源图层进行混合时,柔光模式和强光模式都加强了中间色调的对比度;
不同之处在于,柔光模式加强的较少。

最后附上绘制响应曲线的matlab代码:
不同之处在于,柔光模式加强的较少。

最后附上绘制响应曲线的matlab代码:
%% 基色和混合色相同时 柔光模式 响应曲线,
f1=@(x) x.^2.*(3-2*x);
f2=@(x) 2*x.*(1-x)+sqrt(x).*(2*x-1);

x1=linspace(0,0.5,128);
x2=linspace(.5,1,128);

y1=f1(x1);
y1(y1<0)=0;
y2=f2(x2);
y2(y2>1)=1;
plot([x1 x2],[y1,y2],'LineWidth',3,'Color',[0 0 0])
grid on
hold on
%% 基色和混合色相同时 强光模式 响应曲线
f1=@(x) 2*x.^2;
f2=@(x)  1-2*(1-x).^2 ;

x1=linspace(0,0.5,128);
x2=linspace(.5,1,128);

y1=f1(x1);
y1(y1<0)=0;
y2=f2(x2);
y2(y2>1)=1;
plot([x1 x2],[y1,y2],'LineWidth',3,'Color',[1 0 0])

%% 基色和混合色相同时 正常模式 响应曲线
plot([x1 x2],[x1 x2],'--','LineWidth',2,'Color',[0 0 1])

%%

fontSize=16;
xlabel('基色及混合色灰度值','FontSize',fontSize)
ylabel('结果色','FontSize',fontSize)
title('柔光模式 强光模式 对比','FontSize',fontSize)


legend('柔光模式','强光模式','正常模式','Location','SouthEast')
axis equal
xlim([0 1])
ylim([0 1])