echarts
官网:
http://echarts.baidu.com/
注意:图表的请求必须先请求后台,得到数据,再去渲染图表。所以需要使用同步请求。
1、引入js
<script type="text/javascript" src="${ctx}/shop/resources/plugins/echarts-2.2.1/build/dist/echarts.js"></script>
2、html
<!-- 图表 -->
<div id="chartDiv" class="easyui-panel" title="图表" data-options="closed:true">
<div id="echarts-line" style="height:280px;">
</div>
</div>
<div id="chartDialog" class="easyui-dialog" title="工单处理量" data-options="iconCls:'icon-save',closed:true" style="width:50%;height:85%">
<div class="easyui-panel" data-options="fit:true" style="padding:25px 20px;background-color:#F7F7F7">
<div id="echarts-pie" style="height:100%;"></div>
</div>
</div>
3、画折线图
  function(yAxisData1,yAxisData2){//y轴的值。数组形式
  //在主文件引入后你将获得一个AMD环境,配置require.conifg如下:
   require.config({paths: {echarts:'/shop/resources/plugins/echarts-2.2.1/build/dist'}});
   require(
            [
                'echarts',
                'echarts/chart/line',   // 按需加载所需图表,如需动态类型切换功能,别忘了同时加载相应图表
            ],
            function (ec) {  //回调函数
                var myChart = ec.init(document.getElementById('main'));
                var option = {
                    //这里自己设置
                    legend: {data:['投诉工单','问题工单'],x:'right',y:25},
                    title:{show:true,text:'工单处理量统计',x:'center',y:20},
                    grid:{y:60,x:60,y2:40,x2:40,borderWidth:0,backgroundColor:'#fff'},
                    tooltip:{trigger:'axis',backgroundColor:'rgba(0,0,0,0.5)',axisPointer: {type: 'line'}},
                     xAxis : [{data:customOption.xAxisData,boundaryGap:false,axisLabel:{show:true},splitLine:{show:false}}],
                     series : [{"type":"line","name":'投诉工单',"data":yAxisData1},{"type":"line","name":'问题工单',"data":yAxisData1}]//数据
         yAxis : [{splitLine:{show:false},splitArea:{show:false}}],
                }
                var myChart = ec.init(document.getElementById('main'),'macarons');//初始化图表
                window.onresize = myChart.resize;//动调用resize达到自适应的效果
                myChart.on(ecConfig.EVENT.CLICK, paintPieDynamic);//点击折现图表事件的回调函数
                myChart.setOption(option);//配置图表
            }
        );
}
显示效果:
4、数据传递
 //param,获取折线图的数据
   function paintPieDynamic(param){
   //这里应该通过传递过来的折线图的参数,去请求浒苔,得到饼图数据
    var month = param.name;
    var name = param.seriesName;
    var arr = new Array();
    /*for(prop in codeMap){
     arr.push({value:prop,name:codeMap[prop],code:prop,month:month,type:name});
    }*/
    if(name == "问题工单"){
     var param = {flag:'year',month:month.substring(0,month.length-1),type:3};
    //Ajax请求
     holly.get(holly.getPath()+"/rest/complainSheet/complainListCount",param,function(e){
      if(e.success && e.content != null){
       for(var i = 0 ; i <e.content.length;i++){
        if(e.content[i].PROV != null){
         arr.push({value:e.content[i].TOTAL,name:codeMap[e.content[i].PROV],code:e.content[i].PROV,month:month,type:name});
        }
       }
      }
     },true);
     $("#chartDialog").dialog({title:"问题工单"});
    }else{
     var param = {flag:'year',month:month.substring(0,month.length-1),type:1};
    //Ajax请求
     holly.get(holly.getPath()+"/rest/complainSheet/complainListCount",param,function(e){
      if(e.success && e.content != null){
       for(var i = 0 ; i <e.content.length;i++){
        if(e.content[i].PROV != null){
         arr.push({value:e.content[i].TOTAL,name:codeMap[e.content[i].PROV],code:e.content[i].PROV,month:month,type:name});
        }
       }
      }
     },true);
     $("#chartDialog").dialog({title:"投诉工单"});//是把饼图放在一个dialog中
    }
    $("#chartDialog").dialog('open');
    //饼图的数据arr,从折线图中获取参数,请求后台,组合数据
    paintPie({dom:'echarts-pie',data:arr});
   }
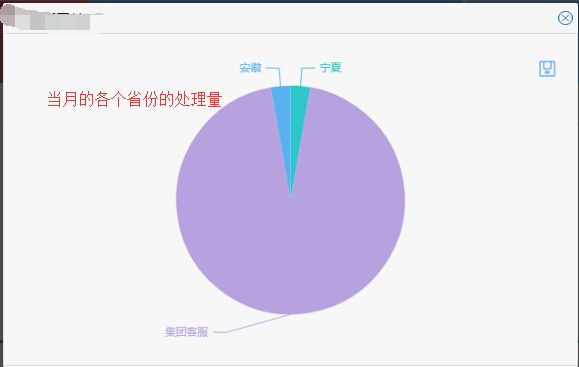
5、画饼图
   function paintPie(customOption){
    require.config({paths: {echarts:holly.getPath()+'/hollybeacon/resources/plugins/echarts-2.2.1/build/dist'}});
    require(['echarts','echarts/chart/pie'],function(ec){
     var ecConfig = require('echarts/config');
     var legendData = [];
     for(var i=0;i<customOption.data.length;i++){
        legendData.push(customOption.data[i].name);
      }
     var option={
        legend:{data:legendData},
         tooltip : {trigger: 'item',formatter: "{a} <br/>{b} : {c} ({d}%)"},
         calculable : false,
         toolbox: {show : true,feature : {mark : {show: false},saveAsImage : {show: true}}},
         series : [{
          center:['50%','50%'],
          name:'工单处理量',
                type:'pie',
                radius : '80%',
                data:customOption.data,
                itemStyle : {
                    normal : {
                        label : {
                            show : true
                        },
                        labelLine : {
                            show : true
                        }
                    },
                },
            }]
     }
     var myChart = ec.init(document.getElementById(customOption.dom),'macarons');
     myChart.on(ecConfig.EVENT.CLICK, tiaozhuan);//点击回调事件,跳转到对应页面
     myChart.setOption(option,true);
    });
   }
显示效果:
6、跳转到对应的页面
//跳转到对应已处理页面
   function tiaozhuan(param){   //遍历传递过来的属性值
   //其实这里应该跳转
    for(prop in param.data){
     console.log(prop+": "+param.data[prop]);
    }
   }
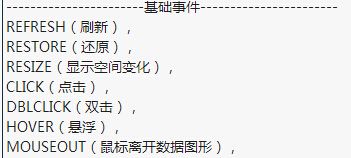
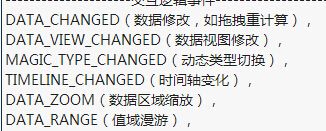
6、图表上的事件
myChart.on(ecConfig.EVENT.CLICK, tiaozhuan);//都是ecConfig.EVENT.事件
如下事件:


