Java与Highcharts实例(二) - Hello Highcharts
好了,首先,我们来实现一个Highcharts版的Hello World
1. 下载Highcharts
在官方网址可以找到下载地址
CSDN下载地址:http://download.csdn.net/detail/jolingogo/8031109
http://www.hcharts.cn/docs/index.php?doc=start-configure
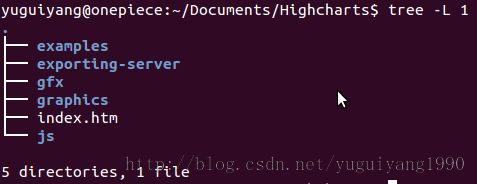
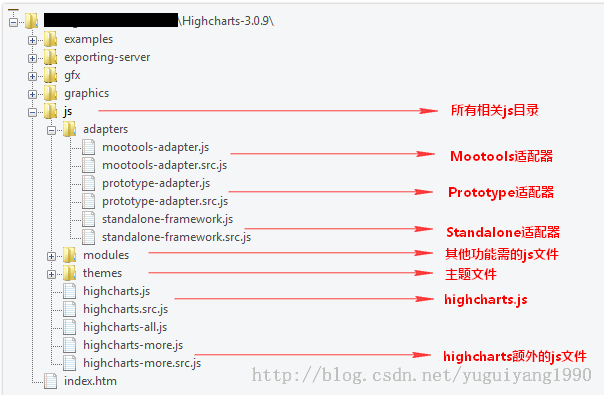
该网站有目录结构介绍:
我这里访问Highcharts官方网站和Google很是慢,所以直接引入本地的JS
2. 配置
2.1 引入Highcharts需要的JS文件
<script src="js/jquery.min.js"></script>
<script src="js/highcharts.js"></script>
2.2 新建DIV容器
这里需要一个容器来展示图表
	<!-- 定义图表的容器 -->
	<div id="container" style="width: 100%; height: 400px;"></div>
2.3 JS代码
<script type="text/javascript">
	$(function() {
		$('#container').highcharts({ //图表展示容器,与div的id保持一致
			chart : {
				type : 'column' //指定图表的类型,默认是折线图(line)
			},
			title : {
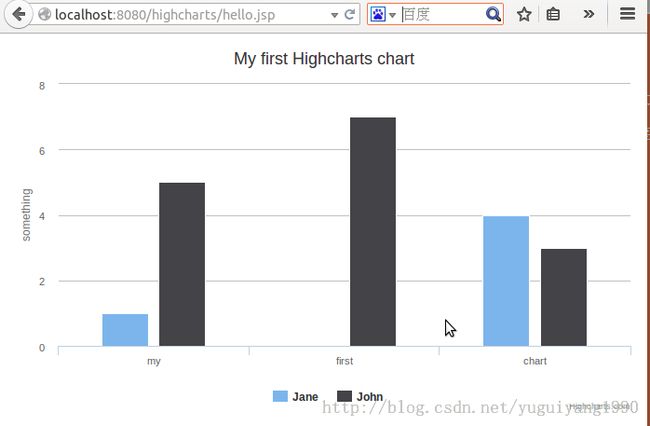
				text : 'My first Highcharts chart' //指定图表标题
			},
			xAxis : {
				categories : [ 'my', 'first', 'chart' ] //指定x轴分组
			},
			yAxis : {
				title : {
					text : 'something' //指定y轴的标题
				}
			},
			series : [ { //指定数据列
				name : 'Jane', //数据列名
				data : [ 1, 0, 4 ] //数据
			}, {
				name : 'John',
				data : [ 5, 7, 3 ]
			} ]
		});
	});
</script>
完整代码:
<%@ page language="java" contentType="text/html; charset=UTF-8"
	pageEncoding="UTF-8"%>
<!DOCTYPE html PUBLIC "-//W3C//DTD HTML 4.01 Transitional//EN" "http://www.w3.org/TR/html4/loose.dtd">
<html>
<head>
<meta http-equiv="Content-Type" content="text/html; charset=UTF-8">
<title>Hello Highcharts !</title>

<script src="js/jquery.min.js"></script>
<script src="js/highcharts.js"></script>

<script type="text/javascript">
	$(function() {
		$('#container').highcharts({ //图表展示容器,与div的id保持一致
			chart : {
				type : 'column' //指定图表的类型,默认是折线图(line)
			},
			title : {
				text : 'My first Highcharts chart' //指定图表标题
			},
			xAxis : {
				categories : [ 'my', 'first', 'chart' ] //指定x轴分组
			},
			yAxis : {
				title : {
					text : 'something' //指定y轴的标题
				}
			},
			series : [ { //指定数据列
				name : 'Jane', //数据列名
				data : [ 1, 0, 4 ] //数据
			}, {
				name : 'John',
				data : [ 5, 7, 3 ]
			} ]
		});
	});
</script>
</head>
<body>
	<!-- 定义图表的容器 -->
	<div id="container" style="width: 100%; height: 400px;"></div>
</body>
</html>


