MatPlotLib(Basemap)与Grads、NCL和GMT的对比
MatPlotLib是python中大名鼎鼎的绘图包,在绘制图形方面比 Grads、 NCL(NCAR Command Language)和 GMT要强大的多,并且借助于python简洁的语法,编程也容易得多,远非后两者可以与之相提并论的.Grads、NCL和GMT只是在Earth System Modeling 和Global Climate Modeling等方面,一直遥遥领先.不过情况已悄悄变化,现在MatPlotLib已推出basemap 1.0.7,可以说basemap在处理文件 (netCDF,hdf,shapefile等) 和 绘图方面,基本上实现了Grads、NCL和GMT的所有功能.
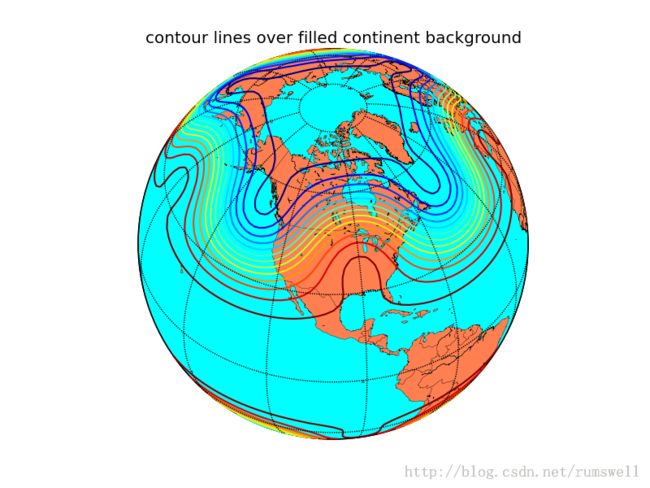
绘制的结果如下:
下面给个例子,让大家感受一下basemap:
from mpl_toolkits.basemap import Basemap
import matplotlib.pyplot as plt
import numpy as np
# set up orthographic map projection with
# perspective of satellite looking down at 50N, 100W.
# use low resolution coastlines.
map = Basemap(projection='ortho',lat_0=45,lon_0=-100,resolution='l')
# draw coastlines, country boundaries, fill continents.
map.drawcoastlines(linewidth=0.25)
map.drawcountries(linewidth=0.25)
map.fillcontinents(color='coral',lake_color='aqua')
# draw the edge of the map projection region (the projection limb)
map.drawmapboundary(fill_color='aqua')
# draw lat/lon grid lines every 30 degrees.
map.drawmeridians(np.arange(0,360,30))
map.drawparallels(np.arange(-90,90,30))
# make up some data on a regular lat/lon grid.
nlats = 73; nlons = 145; delta = 2.*np.pi/(nlons-1)
lats = (0.5*np.pi-delta*np.indices((nlats,nlons))[0,:,:])
lons = (delta*np.indices((nlats,nlons))[1,:,:])
wave = 0.75*(np.sin(2.*lats)**8*np.cos(4.*lons))
mean = 0.5*np.cos(2.*lats)*((np.sin(2.*lats))**2 + 2.)
# compute native map projection coordinates of lat/lon grid.
x, y = map(lons*180./np.pi, lats*180./np.pi)
# contour data over the map.
cs = map.contour(x,y,wave+mean,15,linewidths=1.5)
plt.title('contour lines over filled continent background')
plt.show()
绘制的结果如下:
更多的例子,去Basemap的Example Gallery看看吧:
Basemap的的文档链接为:http://matplotlib.org/basemap/index.html
Wiki也提供了一点coolbook:
http://wiki.scipy.org/Cookbook/Matplotlib/Maps
