visual studio 2015支持Android开发了。
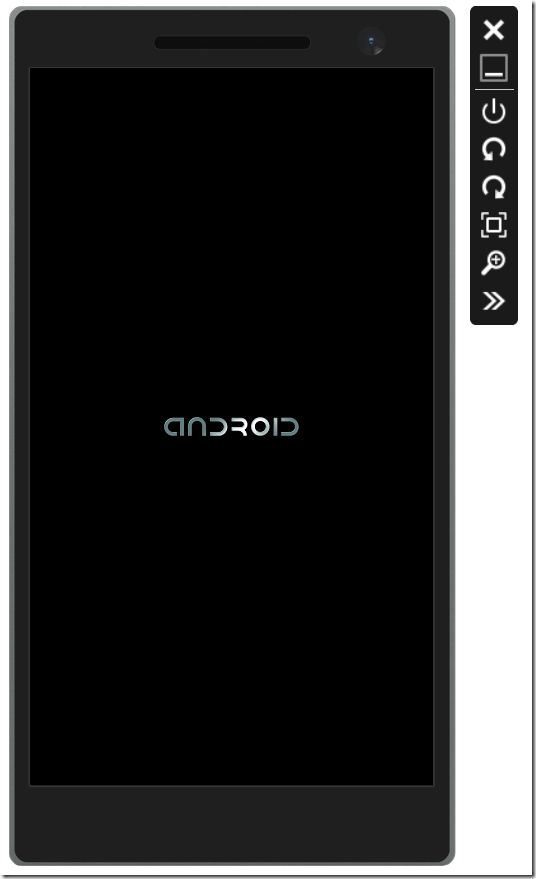
Microsoft released Visual Studio 2015 Preview this week and with it you now have options for Android development. When choosing one of those Android development options, Visual Studio will also install the brand new Visual Studio Emulator for Android to use as a target for debugging your app.

The need for an emulator for Android
We know that emulators can play a key part in the edit-compile-debug cycle (bigger part than devices) and we believe that you need an emulator like the one we are releasing today.
Having a great emulator to debug against doesn’t mean you don’t need a device, and having a device to debug against doesn’t mean you won’t benefit from a good emulator. They are complementary.
You definitely need to test against a device for the following scenarios which are unsuitable for any emulator:
- Measuring the performance characteristics of your code. While an emulator can help you with correctness issues, it will never perfectly emulate the performance characteristics of your code running on the actual devices that you want to test against. You want to measure the performance as your users see it.
- Testing hardware-specific issues. If what you are trying to test is the touch-responsiveness of your game, or the speaker quality for your media app, you will want to do that type of testing on the target devices. Ditto if you are trying to work around an OEM-specific bug.
- Purely evaluating the actual user experience in real-world situations, e.g. do your designed interactions work for a user walking around using your app one handed with just their thumb alone?
For all other testing, which as part of your edit-compile-debug cycle normally takes at least 80% of your time, you’d want to use an emulator (barring other blocking issues or limitations with your emulator of choice). Use an emulator for the following reasons:
- The majority of your testing is for correctness issues (not performance) and the majority of your code is probably not dealing with hardware specific issues. So use an emulator!
- You don’t want to spend a bunch of money buying a bunch of devices (and keep doing so every time a new device appears on the market), just to test things like screen resolution, DPI settings for different screen sizes, different API levels / platform versions, when you can configure that in software (in an emulator).
- You don’t want to have to take physical action with your device to test some sensor, e.g. respond to movement or location changes or simulating network/battery changes. Instead you want to simulate the sensor values easily and quickly in an emulator, e.g. simulate a trip to another town while your app responds to the change of location.
- There is also the convenience element. Connecting to a device (typically dealing with cables), managing that connection and its lifetime, using one of your USB ports, is not as simple as launching the emulator and treating it like every other desktop application running on your dev machine.
So emulators are great and can be a key part in the edit-compile-debug cycle and we want to make sure that our emulator is best-in-class. You have told us about several pain points with existing emulators that we are starting to address with our release:
- Slow. This is the number one complaint we’ve heard from Android developers. “The emulator is painfully slow, it hurts my productivity, and I’ll use a device.” Slow is not acceptable. If anything, using the emulator should be faster than using a device so you can test your scenarios faster (remember, you are not using emulators to test the performance of our code, you just need them to be as fast as possible for your own use).
- Conflict with Hyper-V on Windows. Many emulators require you to disable Hyper-V or don’t work as well with Hyper-V as they do without. Using Hyper-V is part of the development setup for many developer activities, so asking you to restart your machine (multiple times a day) to toggle Hyper-V is not acceptable.
- o One specialized variant of this is using the Windows Phone emulator (which itself is based on Hyper-V). It is a real pain having to make changes and reboot every time you want to switch from an Android emulator to a Windows Phone emulator to test your cross-platform code.
- Additional acquisition and installation step. If your main development environment is Visual Studio, you don’t want to have to acquire the emulator separately and follow a separate installation process.
- Separate cost. Having a great emulator that can cost you as much as your main development environment is not an option for most. The Visual Studio Emulator for Android comes with VS without additional charge.
In short, we will address all of those pain points with the Visual Studio Emulator for Android. Now, let’s recap Visual Studio’s debugging story for Android and how to choose the VS Emulator for Android.
Debugging against the Visual Studio Emulator for Android
With Visual Studio 2015 Preview you can target Android and edit-compile-debug regardless of your choice of programming models: JavaScript (or TypeScript) with Cordova, C++, or C# with Xamarin.
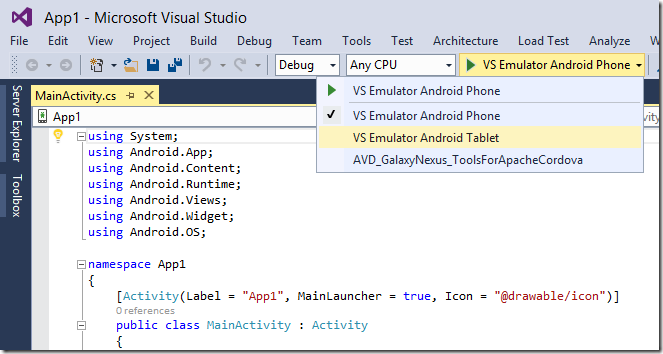
With all three of those choices, when you start debugging, you must first choose a target. That target can be a device, or it can be one of many emulators that you may have running on your machine. Let’s see how to choose a debug target for Cordova and C++ in Visual Studio 2015 Preview, and for Xamarin in Visual Studio 2013.
With C++ projects, the Debug Target menu looks like this:

With Cordova projects you will want to pick the last two entries in the Debug Target menu as per the following screenshot:
(definitely avoid picking the option “Android Emulator” as that is the slow one that comes with the SDK)
With Xamarin projects, the option looks like this:

For best results with Xamarin projects, disable/uncheck "Use Fast Deployment" under the Android Options under the Xamarin Project Properties.
Note: If you want to use the VS Emulator for Android from a different IDE, as a temporary workaround you can always launch our emulator from Visual Studio using one of the options above, then close that project and leave the emulator running and available for your other IDE to target (over ADB).
Once you have chosen your debug target and hit F5, your app will be deployed to the emulator, as per the regular VS debugging flow you can hit breakpoints in your code, see the call stack, inspect variables, etc. So now that you know how to use the emulator for debugging, let’s continue exploring its cool features!
Sensor simulations and other capabilities of the Visual Studio Emulator for Android
Beyond using the emulator as a deployment target, you can also take advantage of sensor simulation and other capabilities – let’s examine a few of those, in no particular order.

Zoom
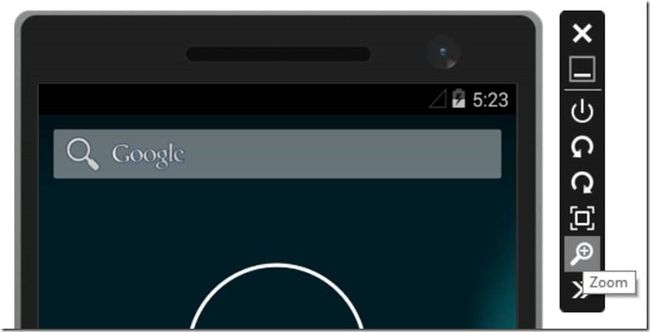
You can change the size of the emulator as you see it on your development machine (the host). The dots per inch (DPI) for the emulator is based on the host monitor DPI, regardless of the zoom value. This allows you to scale the emulator in case it is taking too much space on your desktop.
To change the size, use the “Zoom” button on the emulator’s vertical toolbar.
You can also use the “Fit to Screen” button above the “Zoom” button to fit the emulator on your screen.
If you are going to take screenshots of your app running in the emulator (e.g. with the Snipping tool) for best results remember to set the zoom level to the maximum of 100% - or even better, use our built-in Screenshot tool support that I describe below.
Orientation / Rotation
Unless your app only supports a fixed orientation, you should test how your app responds to orientation changes, and what it looks like in portrait, left-landscape, and right-landscape orientations. Simply rotate the emulator left or right with the two corresponding buttons on the vertical toolbar: “Rotate Left” and “Rotate Right”. The size of the emulator remains the same when you rotate.
Network Info
The emulator reuses the network connection of the host machine, so there is nothing for you to configure.
You can also review the emulator’s current network settings. On the vertical toolbar click on the “Tools” button to show the “Additional Tools” fly out panel, and then click on the “Network” tab.
Location (GPS)
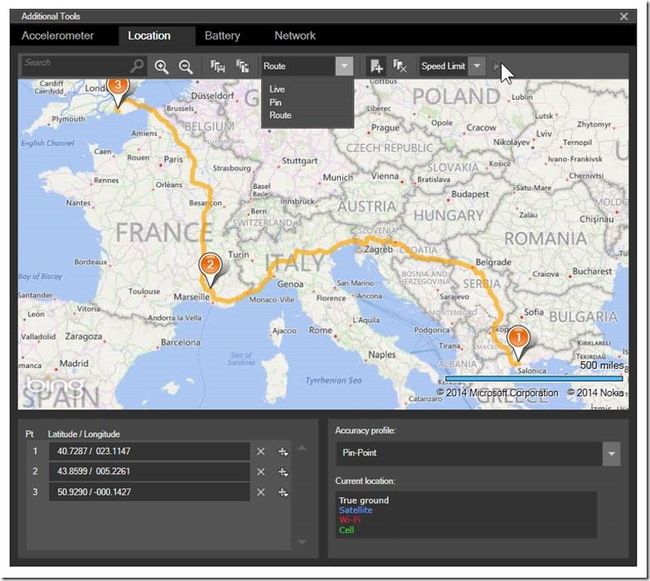
If your app does anything with navigation, geofencing, walking/biking/driving, then you will love the location and driving simulation in the emulator under the “Location” tab when you open the “Additional Tools”.

You can navigate the map by dragging it around, by zooming/in and out, or even by searching for a location. You can place and remove pins on the map, thus creating map points. Those appear as latitude longitude coordinates in the list in the bottom left. From the toolbar at the top you can even save those map points to an XML file and later load them from the file.
Instead of having each map point immediately change the GPS location of the emulator (“Live” mode), you have other options too! You may want to place a few map points and then simulate transitioning between those points. To do that, at the toolbar at the top switch from “Live” mode to “Pin” mode. Then you can press the small play button at the end of the toolbar to transition between the map points. You can even enter a transition interval (in seconds).
Finally, you can choose a third mode that is similar to “Pin”, which is called “Route” mode. In this mode you can also simulate transitions between the points but with some additional twists. The simulator will calculate an actual path between the points and generate invisible points at 1 second intervals between the points you choose. The overall speed at which it will play those points is determined by a second setting and your options are: “Walking” (5 kilometers per hour), “Biking” (25 km/h), “Speed Limit” (variable dependent on map point), and “Fast”.
Accelerometer
If your app tracks and responds to movement of the phone, you can test them using the “Accelerometer” tab when you open the “Additional Tools”.
Simply click and hold the red dot in the middle and drag it towards the directions you want to simulate, within the 3D plane. As you do that your app will receive movement events if it has registered for them.
You can also see the X, Y, Z values in the bottom left. Under those values you can “Reset” to the starting position, and also pick the starting Orientation from these values: Portrait Standing, Landscape Standing, Portrait Flat, and Landscape Flat.
Lastly you can simulate the phone shaking by clicking the “Play” button in the bottom right. The only visual indication that a shake is taking place are the values of the X,Y,Z and when they stop rapidly changing you’ll know the shake is over.
Power/Battery Simulation (and Power button)
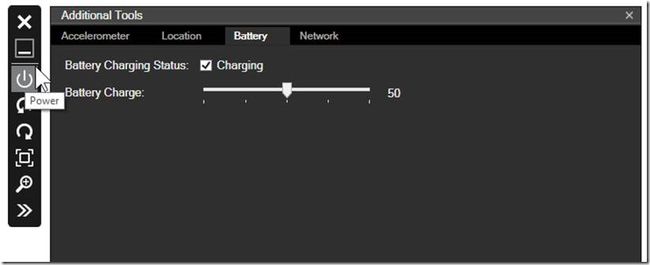
If you write your app to respond to battery charge changes, then you will like the emulator’s ability to simulate that by switching to the “Battery” tab when you open the “Additional Tools”.
There is a slider that allows you to set the exact charge value of the battery. Notice as you slide down/up how the battery icon in the top right changes to reflect the change. Your app can also respond accordingly.
If you change the Battery Charging State to not be “Charging”, then the emulator’s screen will go blank after a timeout period. You can configure the timeout though the built-in regular "Settings" app (look for the “Sleep” option under “Display”). If the emulator sleeps due to this, then you can wake it up through the “Power” button on the vertical toolbar.

Screenshot
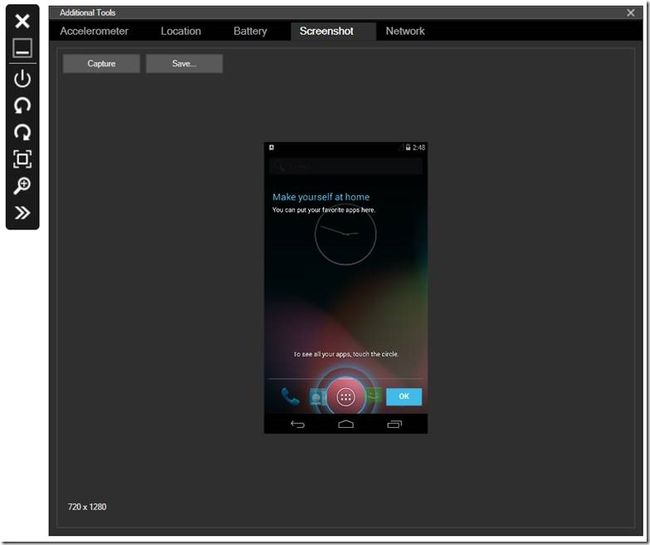
To take a screenshot of your app, open the “Additional Tools” and switch to the “Screenshot” tab. Then click on the “Capture” button, which will take a screenshot and show you an instant preview. If you want to keep the screenshot click on the “Save…” button. If you don’t like the screenshot you took, ignore it or click “Capture” again.

The screenshot tool always takes screenshots at 100% (indicated by the resolution in the bottom left corner), regardless of Zoom setting. They are also always portrait, regardless of rotation chosen.
Install APKs through drag and drop
You install apps on Android through an application package file which is known as an APK. If you have an APK that you want to install on the Visual Studio Emulator for Android, just drag it onto the emulator from Windows Explorer. You will see a message in the emulator indicating progress “File transfer in progress…” followed by a message box “File foo installed successfully in Android”. Remember to make sure your APKs have code built for x86!
You can also drag and drop other (non-APK) files to the emulator and they will be placed onto the SD Card, which brings us to the next topic.
SD Card
If your app has a need to read or write to the SD card of the target, the emulator simulates that by making available a folder representing an SD card.
Note that the Android image uses a separate VHD for SD card support. So if you want to transfer files to/from the SD card on your development machine, you can mount the VHD to Windows: Close the emulator (to shut down the VM), then navigate to the VHD location in Windows explorer, and double click the VHD to mount it. By default the VHD is located under the path:
C:\Users\%username%\AppData \Local\Microsoft\XDE\Android\vsemu.sdcard.vhd
At this point, the VHD is mounted as an additional drive to Windows and you can use it pretty much like any other drive. Before restarting the emulator you must un-mount the VHD, which you can do by right clicking on the drive and selecting Eject.
Having SD card support in the image also allows other built-in Android apps to function, such as the browser downloads and the camera app – which brings me to the next capability.
Camera
Typically you’d be using the camera from your app (using an appropriate API), and we support that. You can also use the built-in camera app directly. When you launch the camera in the emulator you will see a fixed animated image that you can take a snapshot of, simulating taking a picture.
Audio Playback, Keyboard Text Input…
There are other capabilities that the emulator provides that are taken for granted, even though they require “work” from the product team :-). I won’t list them all here but two of them are that:
- you can use your computer’s keyboard to enter text in the emulator
- any audio coming from the emulator can be heard through your computer’s speakers
Configurations
With this Preview release you can pick between two out of the box configurations:
- Typical Android Phone: 5” Screen, 295 PPI, 720x1280, 1024 MB
- Typical Android Tablet: 7” Screen, 315 PPI, 1080x1920, 2048 MB
With the Preview bits if you want to change the amount of memory, you can change the Startup RAM in the Settings dialog from the Hyper-V Manager. Notice that there you can also change the number of cores allocated to each configuration (the default for Preview is 2 cores). Caveat: we have not tested all possible configurations you could choose!
We are just getting started, there is a lot more to come in subsequent releases and you can help us prioritize new sensor simulation and other capabilities by taking our survey.
A peek under the covers
If you are interested in how we built the Visual Studio Emulator for Android, the short answer is that we reused the work of others. Conceptually, an emulator consists of 4 pieces:
- A virtual machine (represented as a vhd) of the target you are emulating, in this case Android. We started with the source at the Android Open Source Project (AOSP), evolved it, and configured an x86 virtual image for fast Visual Studio debugging.
- A small shell/chrome that as a user you see and interact with, which loads the virtual image and projects it through a rendering control. Think of this as remote desktop: you are essentially RDPing to the image. We started with the desktop application that is the shell/chrome of the Windows Phone Emulator (internally known as XDE), which is already rich in functionality. Then we made modifications for our Android-specific needs.
- A virtualization technology that XDE needs to load the image before it can RDP to it. Windows has a great virtualization technology called Hyper-V and that is what we used.
- The connection pipeline between VS and XDE and also between the debug engine and the virtual image. Here we reused parts of what existed between XDE and Visual Studio, and also the Android Debug Bridge (ADB) channel.
Now let’s look at some of the limitations we have today, and hopefully you can give us input on which ones we need to address first.
Current limitations
Today we are sharing with you an early preview release, with issues/bugs that we look forward to you reporting to us. We also have known limitations – please tell us which ones are most important to you so we can prioritize these on our backlog:
- If your app makes direct or indirect use of OpenGL 2 or higher, that will not render on our emulator yet. This support is coming soon, and looking at an early internal-only build that I have it does make the image feel even snappier!
- There are many different versions of Android on the market. The one you have with this release of the Visual Studio Emulator for Android is KitKat API 19 (version android-4.4.4_r1). More versions coming later…
- If your app takes advantage of the Google Play Services layer then it will not work out of the box in our emulator. That is because when building our Android images we do not include the GMS packages (which require additional licensing that we do not have yet).
- You need to recompile your code for x86. If you have parts of your code that can only be compiled for ARM, or you depend on 3rd-party libraries for which you do not have an x86 version, your code will not run on our emulator at this point.
- You can only install the Visual Studio Emulator for Android on an operating system where Hyper-V is supported. Examples of where Hyper-V is not supported include Windows 7, non-Windows machines, and inside another VM.
If any of these limitations are an issue for an app you are developing, then the workaround is to use a device (or find another emulator that may not have the limitation). We will be making this current list of limitations shorter with every release that we put out, so please take the survey to help us prioritize.
