扩展graphiclayer实现多城市天气情况的展示
概述:
在上一节,实现了点击展示城市天气的效果,在本节,讲述通过扩展graphiclayer实现同时显示多个城市天气的展示。
效果:
重庆市天地图天气展示效果
实现后的效果
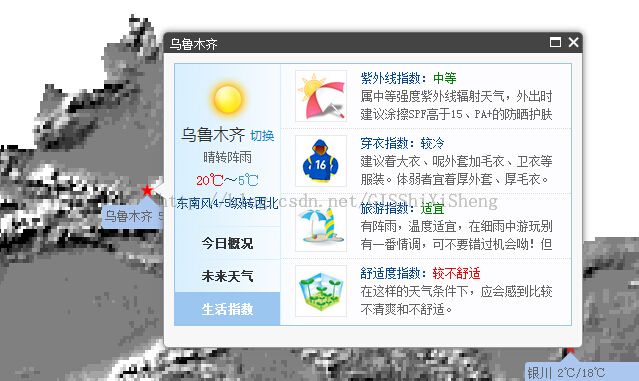
详细天气信息
实现:
1、实现思路
通过个城市的地图位置,通过map.toScreen()函数转换为屏幕坐标,在每个城市的位置创建一个div用来显示概要天气信息。那么,该如何控制每一个div的位置呢,可以通过div的属性position,left,top值来控制,其中,position为绝对(absolute)位置,left为screenPoint.x,top为screenPoint.y。
2、实现代码
a、封装graphiclayer WeatherGraphicLayer.js
define([
    "dojo/_base/declare",
    "esri/layers/GraphicsLayer"
], function (
    declare,
    GraphicsLayer
    ) {
    return declare([GraphicsLayer], {
        constructor: function(options) {
            this._id = options.id || "";
            this._divId = options.divId || "chart";
            this._bindGraphicLayer = options.bindGraphicLayer || null;
        },
        // 重构esri/layers/GraphicsLayer方法
        _setMap: function(map, surface) {
            // GraphicsLayer will add its own listener here
            var div = this.inherited(arguments);
            return div;
        },
        _unsetMap: function() {
            this.inherited(arguments);
        },
        hide: function() {
            var _graphics = this.graphics;
            console.log(_graphics);
            for(var i= 0,dl =_graphics.length;i<dl;i++){
                var graphic = _graphics[i].graphic;
                var py =graphic.attributes.pinyin;
                $("#div_"+py).hide();
                $("#div_"+py).remove();
            }
        },
        show: function() {
            var _graphics = this.graphics;
            for(var i= 0,dl =_graphics.length;i<dl;i++){
                var graphic = _graphics[i].graphic;
                var py =graphic.attributes.pinyin;
                $("#div_"+py).show();
            }
        },
        //拖拽
        _onPanStartHandler: function() {
            this.hide();
        },
        //缩放
        _onZoomStartHandler:function(){
            this.hide();
        },
        _onExtentChangeHandler: function(delta, extent, levelChange, lod) {
            this._refresh(true, true);
        },
        _refresh: function(redrawFlag, zoomFlag) {
            var gs = this.graphics,
                _draw = this._draw;
            for (i = 0; i < gs.length; i++) {
                _draw(gs[i], redrawFlag, zoomFlag);
            }
            this.show();
        },
        _draw:function(addGraphic, redrawFlag, zoomFlag){
            if (!this._map) {
                return;
            }
            var py = addGraphic.graphic.attributes.pinyin;
            if (zoomFlag) {
                $("#div_"+py).remove();
            }
            var mapPt = addGraphic.graphic.geometry;
            var srcPt = map.toScreen(mapPt);
            var url = "http://i.tianqi.com/index.php?c=code&id=30&color=%23FF0000&py="+py;
            var showDiv = $("<div />").attr("id","div_"+py)
                .css("position","absolute")
                .css("top",(srcPt.y+15)+"px")
                .css("left",(srcPt.x-45)+"px")
                .addClass("weather-box")
                .appendTo($("#map"));
            var weatherIframe = $("<iframe />").attr("width","120")
                .attr("id","ifm_"+py)
                .attr("height","14")
                .attr("frameborder","0")
                .attr("scrolling","no")
                .attr("margin","0px")
                .attr("overflow","hidden")
                .attr("src",url);
            var upArrow = $("<div />").addClass("entry-trangle-top").appendTo(showDiv);
            showDiv.append(weatherIframe);
        }
    });
});
b、前端实现
新建一个WeatherGraphicLayer,并添加到map。
                    var weather = new WeatherGraphicLayer({"id":"weather",displayOnPan:false});
                    map.addLayer(weather);
添加城市图层的graphic-add事件
                    city.on("graphic-add",function(addGraphic){
                        weather.add(addGraphic);
                    });
这样,多城市的天气信息展示已完成,点击显示详细信息在上一节中已说明,代码如下:
                    city.on("click",function(evt){
                        var url = "http://i.tianqi.com/index.php?c=code&id=27&color=%23&bgc=%23&icon=2&py="+evt.graphic.attributes.pinyin+"&temp=1&num=1";
                        var title = evt.graphic.attributes.name;
                        var content = $("<div />");
                        var weatherIframe = $("<iframe />").attr("width","400")
                                .attr("height","270")
                                .attr("frameborder","0")
                                .attr("scrolling","no")
                                .attr("src",url);
                        content.append(weatherIframe);
                        map.infoWindow.setTitle(title);
                        map.infoWindow.setContent(content[0]);
                        map.infoWindow.resize(420,275);
                        map.infoWindow.show(evt.graphic.geometry);
                    });


