南沙政府应急系统之GIS一张图(arcgis api for flex)讲解(十三)台风模块
config.xml文件的配置如下:
<widget label="台风" icon="assets/images/typhoon.png" config="" url="widgets/ActualWeather/TyphoonWarningWidget.swf"/>
源代码目录如下:
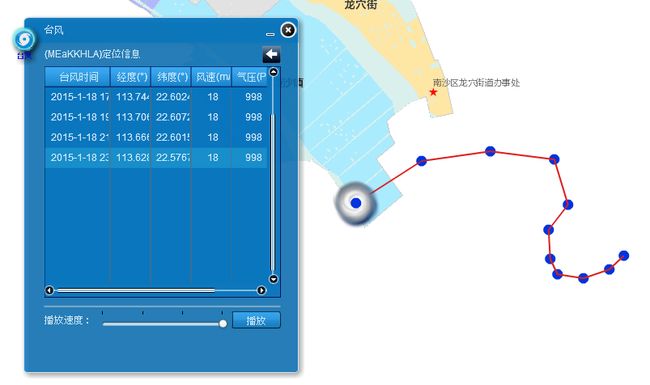
界面效果:
大概的思路如下:从后台数据库获取台风的信息列表,展示在界面的表格里面;点击某条台风选项时候,会动态的在地图上展示台风的轨迹信息出来,点击某个时刻的台风轨迹时候,会弹出该时刻的台风详情气泡窗口来展示;
具体的技术:利用arcgis api的Geometry(Point、Polyline)、Graphic、infowindow等等,就是把台风点轨迹连成线,然后把点和线描绘出来展示在地图上。
TyphoonWarningWidget.mxml:
<?xml version="1.0" encoding="utf-8"?> <viewer:BaseWidget xmlns:fx="http://ns.adobe.com/mxml/2009" xmlns:s="library://ns.adobe.com/flex/spark" xmlns:mx="library://ns.adobe.com/flex/mx" xmlns:esri="http://www.esri.com/2008/ags" xmlns:viewer="com.esri.viewer.*" creationComplete="init()" width="340" height="440" > <fx:Declarations> </fx:Declarations> <fx:Script> <![CDATA[ import com.esri.ags.Graphic; import com.esri.ags.SpatialReference; import com.esri.ags.geometry.Geometry; import com.esri.ags.geometry.MapPoint; import com.esri.ags.geometry.Polyline; import com.esri.ags.layers.GraphicsLayer; import com.esri.ags.symbols.PictureMarkerSymbol; import com.esri.ags.symbols.SimpleLineSymbol; import com.esri.ags.symbols.SimpleMarkerSymbol; import com.esri.ags.symbols.Symbol; import com.esri.ags.symbols.TextSymbol; import flash.globalization.NumberFormatter; import flash.utils.clearInterval; import flashx.textLayout.elements.BreakElement; import mx.collections.ArrayCollection; import mx.controls.Alert; import mx.controls.Text; import mx.core.FlexGlobals; import mx.events.CloseEvent; import mx.events.ListEvent; import mx.events.SliderEvent; import mx.formatters.Formatter; import mx.managers.PopUpManager; import spark.events.DropDownEvent; import spark.events.IndexChangeEvent; import spark.events.TitleWindowBoundsEvent; //台风10年年份集合 private var dt:Date = new Date(); private var yearnow:String=dt.fullYear.toString(); private var yearReduceOne:int=dt.fullYear-1; private var yearReduceTwo:int=dt.fullYear-2; private var yearReduceThree:int=dt.fullYear-3; private var yearReduceFour:int=dt.fullYear-4; private var yearReduceFive:int=dt.fullYear-5; private var yearReduceSix:int=dt.fullYear-6; private var yearReduceSeven:int=dt.fullYear-7; private var yearReduceEight:int=dt.fullYear-8; private var yearReduceNine:int=dt.fullYear-9; /** *@autor:hanhh *@function: 台风功能 *@date:2015/3/8 */ [Bindable] private var tfData:ArrayCollection=new ArrayCollection ([ {formatTF_TIME :"2015-1-18 2时",tfLongitude:"113.92020120006099",tfLatitude:"22.58297969742287",tfFs :"18",tfQy:"998"}, {formatTF_TIME :"2015-1-18 3时",tfLongitude:"113.90973157163533",tfLatitude:"22.57488953000305",tfFs :"18",tfQy:"998"}, {formatTF_TIME :"2015-1-18 4时",tfLongitude:"113.88974409918636",tfLatitude:"22.572510068997218",tfFs :"18",tfQy:"998"}, {formatTF_TIME :"2015-1-18 6时",tfLongitude:"113.87023251893855",tfLatitude:"22.573937745600716",tfFs :"18",tfQy:"998"}, {formatTF_TIME :"2015-1-18 8时",tfLongitude:"113.84831768307485",tfLatitude:"22.57822077541121",tfFs :"18",tfQy:"998"}, {formatTF_TIME :"2015-1-18 12时",tfLongitude:"113.81357755238973",tfLatitude:"22.588214511635698",tfFs :"18",tfQy:"998"}, {formatTF_TIME :"2015-1-18 14时",tfLongitude:"113.79075852134382",tfLatitude:"22.599635924463684",tfFs :"18",tfQy:"998"}, {formatTF_TIME :"2015-1-18 16时",tfLongitude:"113.77315050990067",tfLatitude:"22.60867787628584",tfFs :"18",tfQy:"998"}, {formatTF_TIME :"2015-1-18 18时",tfLongitude:"113.7488800076412",tfLatitude:"22.620099289113824",tfFs :"18",tfQy:"998"}, {formatTF_TIME :"2015-1-18 20时",tfLongitude:"113.73317556500272",tfLatitude:"22.63009302533831",tfFs :"18",tfQy:"998"}, {formatTF_TIME :"2015-1-18 21时",tfLongitude:"113.72268214196701",tfLatitude:"22.631996594142976",tfFs :"18",tfQy:"998"}, {formatTF_TIME :"2015-1-18 23时",tfLongitude:"113.70367024853043",tfLatitude:"22.63247248634414",tfFs :"18",tfQy:"998"} ]); private var tfDataNew:ArrayCollection=new ArrayCollection ([ {formatTF_TIME :"2015-1-18 4时",tfLongitude:"113.78552370713099",tfLatitude:"22.54586010573192",tfFs :"18",tfQy:"998"}, {formatTF_TIME :"2015-1-18 6时",tfLongitude:"113.77695764751",tfLatitude:"22.537769938312096",tfFs :"18",tfQy:"998"}, {formatTF_TIME :"2015-1-18 7时",tfLongitude:"113.76172909707269",tfLatitude:"22.53253512409927",tfFs :"18",tfQy:"998"}, {formatTF_TIME :"2015-1-18 9时",tfLongitude:"113.74647675202532",tfLatitude:"22.5349145851051",tfFs :"18",tfQy:"998"}, {formatTF_TIME :"2015-1-18 11时",tfLongitude:"113.74221751682488",tfLatitude:"22.543956536927254",tfFs :"18",tfQy:"998"}, {formatTF_TIME :"2015-1-18 13时",tfLongitude:"113.74124193781248",tfLatitude:"22.561088656169233",tfFs :"18",tfQy:"998"}, {formatTF_TIME :"2015-1-18 15时",tfLongitude:"113.7526395560304",tfLatitude:"22.57584131440538",tfFs :"18",tfQy:"998"}, {formatTF_TIME :"2015-1-18 17时",tfLongitude:"113.7445969778307",tfLatitude:"22.60249127767068",tfFs :"18",tfQy:"998"}, {formatTF_TIME :"2015-1-18 19时",tfLongitude:"113.70697769932852",tfLatitude:"22.60725019968234",tfFs :"18",tfQy:"998"}, {formatTF_TIME :"2015-1-18 21时",tfLongitude:"113.66655065683946",tfLatitude:"22.601539493268348",tfFs :"18",tfQy:"998"}, {formatTF_TIME :"2015-1-18 23时",tfLongitude:"113.62800338854501",tfLatitude:"22.576793098807713",tfFs :"18",tfQy:"998"} ]); [Bindable] // 是否播放了.0:未播放,1:播放了。以播放情况下才可以通过列表关联到气泡 private var isPlay:Number = 0; // 判断是不是播放到最后一点 public var isPlayEndPoint:Boolean = false; // 判断台风是否在播放中 public var isPlaying:Boolean = false; // 保存单击双击事件的状态 public var tfxxTitle :String=null; //保存台风的中文名以便导出时使用 public var tfZWName:String=null; // 保存单击双击事件的状态 private var interval :Number= 0; private var tfInfoLayer:GraphicsLayer;//显示台风信息 private var showTfNameIndex:String=""; [Bindable] private var tfHistoryList:ArrayCollection=new ArrayCollection ([ {id:"201501",happenTime:"2015-1-18",tfZhName:"",tfName :"MEaKKHLA",tfqd:"台风"}, {id:"201502",happenTime:"2015-2-18",tfZhName:"",tfName :"HIGOS",tfqd:"强台风"} ]); private var typhoonSpeed:Number=0; /** * 初始化页面 * @autor:hanhh */ public function init():void{ this.isResizeable = false; //取得当年台风列表 var tfHappendTime:String; tfHappendTime=tfYear_DropDownList.selectedItem.tfHappendTime; //add by gwli graphicsLayer=new GraphicsLayer(); map.addLayer(graphicsLayer); //add hanhh tfInfoLayer=new GraphicsLayer() map.addLayer(tfInfoLayer); } /** * 播放、停止 * @autor:hanhh */ public function button1_clickHandler(event:MouseEvent):void { graphicsLayer.clear(); points =new Array(); //再次播放时定位到最上面 if(tfData.length>10){ this.dataGrid.selectedIndex = 0; this.dataGrid.verticalScrollPosition=dataGrid.selectedIndex; } isPlaying = true; isPlay = 0; this.backButton.enabled = false; this.playbutton.enabled = false; recor=0; intervaltime = setInterval(drawTrace, typhoonSpeed,tfData); //播放速度关联 } private var points:Array;//保存表格数据集的经纬度点集合 private var polyline:Polyline;//线定义 private var lastDrawGraphic:Graphic; //保存绘制线graphic private var GraphicMarker:Graphic;//保存绘制点轨迹graphic private var GraphicPicture:Graphic;//保存图片picturegraphic [Bindable] private var graphicsLayer:GraphicsLayer;//显示绘制图的layer //private var picgraphicsLayer:GraphicsLayer;//显示swf图标的layer //定时器 private var intervaltime:uint; private var recor:int=0;//用来判断是否结束时间间隔函数的标识 /** * 绘制轨迹函数 * data,表格数据集,含有经纬度信息,用来描绘用的 */ public function drawTrace(data:ArrayCollection):void{ //判断是否删除台风动态swf图标,保证地图上只显示一个 if(GraphicPicture!=null && recor<data.length){ graphicsLayer.remove(GraphicPicture); } polyline = new Polyline(); lastDrawGraphic = new Graphic(); GraphicMarker = new Graphic(); GraphicPicture = new Graphic(); lastDrawGraphic.symbol = new SimpleLineSymbol(SimpleLineSymbol.STYLE_SOLID, 0xDD2222, 0.8, 2);//设置线符号 GraphicMarker.symbol = new SimpleMarkerSymbol(SimpleMarkerSymbol.STYLE_CIRCLE, 13, 0x0033DD);//设置点符号 GraphicPicture.symbol = pic; if(recor<data.length){ this.dataGrid.selectedIndex = recor;//实现轨迹点和datagrid的联动效果 // 【台风改造】当台风的定位信息只有一页时,点击播放按钮,播放完毕后,整个数据会上移,而没有滚动条 // 当前选择行居中 if(recor>9){ this.dataGrid.verticalScrollPosition=dataGrid.selectedIndex-3; } var mp:MapPoint = new MapPoint(Number(data.getItemAt(recor).tfLongitude),Number(data.getItemAt(recor).tfLatitude),map.spatialReference);//获取经纬度信息, 转换为点 GraphicMarker.geometry = mp; GraphicMarker.attributes = { tfLongitude: data.getItemAt(recor).tfLongitude,tfLatitude: data.getItemAt(recor).tfLatitude,formatTF_TIME: data.getItemAt(recor).formatTF_TIME,tfFs: data.getItemAt(recor).tfFs, tfQy: data.getItemAt(recor).tfQy };//台风时间,风速,气压 GraphicPicture.geometry =mp; points.push(mp); polyline.addPath(points); lastDrawGraphic.geometry = polyline; //GraphicMarker.addEventListener(MouseEvent.CLICK, onGraphicClick);//添加点单击graphic的监控事件 GraphicMarker.addEventListener(MouseEvent.MOUSE_OVER, onGraphicMouseOver);//添加鼠标overgraphic的监控事件 GraphicMarker.addEventListener(MouseEvent.MOUSE_OUT, onGraphicMouseOut);//添加鼠标outgraphic的监控事件 graphicsLayer.add(lastDrawGraphic);//添加线 graphicsLayer.add(GraphicPicture);//添加swf台风图标 graphicsLayer.add(GraphicMarker);//添加点 if(points.length>1) map.zoomTo(polyline); else map.zoomTo(mp); } else{ if(intervaltime){ clearInterval(intervaltime); } this.backButton.enabled = true; this.playbutton.enabled = true; } recor++; } /** * graphic mouseover事件 * 获取各个时刻的点轨迹详细信息 * 气泡弹出框来显示详细的信息 */ private function onGraphicMouseOver(event:MouseEvent):void { var graphic:Graphic=event.currentTarget as Graphic; //Alert.show("经纬度:"+graphic.attributes.tfLongitude+","+graphic.attributes.tfLatitude+"\n"+"台风时间:"+graphic.attributes.formatTF_TIME+"\n"+"风速:"+graphic.attributes.tfFs+"\n"+"气压:"+graphic.attributes.tfQy); var text:Text = new Text(); text.text="经纬度:"+graphic.attributes.tfLongitude+","+graphic.attributes.tfLatitude+"\n"+"台风时间:"+graphic.attributes.formatTF_TIME+"\n"+"风速:"+graphic.attributes.tfFs+"\n"+"气压:"+graphic.attributes.tfQy; map.infoWindow.content =text; map.infoWindow.closeButtonVisible=true; map.infoWindow.show(graphic.geometry as MapPoint); } /** * graphic mouseout事件 * 获取各个时刻的点轨迹详细信息 * 气泡弹出框来显示详细的信息 */ private function onGraphicMouseOut(event:MouseEvent):void { map.infoWindow.hide(); } /** * 改变播放速度 * @autor:hanhh */ private function changeSpend(event:SliderEvent):void{ // 修改播放速度,在右端播放速度快 typhoonSpeed =(0.5-Number(this.timeSelect.value))*1000; } /** *在年份下拉列表选择某一年取得台风列表 * @autor:hanhh */ protected function dropDownYearList_closeHandler(event:DropDownEvent):void{ //取得选取台风发生年份 var tfHappendTime:String=tfYear_DropDownList.selectedItem.tfHappendTime; } /** * @autor:hanhh *单击台风列表取得台风的详细信息 */ private function tfitemClick(event:ListEvent):void{ tfInfoLayer.clear(); this.playbutton.enabled = true; this.backButton.enabled = true; isPlay = 0; this.playbutton.enabled = true; // 修改播放速度,在右端播放速度快 typhoonSpeed =Number(this.timeSelect.value)*1000; //得到选择项目的objec var selectedObj:*=this.tfDataGrid.selectedItem as Object; //如果有数据则弹出详细台风数据窗口 if(selectedObj.tfZhName!="没有台风数据"){ this.title.text=selectedObj.tfZhName+"("+selectedObj.tfName+")定位信息"; this.tfDetail.visible=true; this.backButton.visible = true; this.tf.visible=false; this.playbutton.visible = true; tfxxTitle =selectedObj.tfZhName+"("+selectedObj.tfName+")"; tfZWName=selectedObj.tfZhName; tfData=null; tfData =tfDataNew; } showTfNameIndex = ""; showTfNameIndex += selectedObj.happenTime.substring(0,4)+"年第"+String(selectedObj.id).substr(2,selectedObj.id.length)+"号台风 "+selectedObj.tfZhName+"("+selectedObj.tfName+")\n"; var textSymbol:TextSymbol=new TextSymbol(showTfNameIndex); this.left= Capabilities.screenResolutionX/7-this.width/7; this.top=Capabilities.screenResolutionY/7; var point:MapPoint=map.toMapFromStage(Number(this.left),Number(this.top)); var graphic:Graphic=new Graphic(point); var textFormat:TextFormat=new TextFormat("Arial", 16, 0xe10601, true); textSymbol.textFormat=textFormat; graphic.symbol=textSymbol; tfInfoLayer.add(graphic); } /** * 风列表修改 * @autor:hanhh * */ public function openTfInfo(event:Event):void{ this.tfDetail.visible=false; this.backButton.visible = false; this.title.text="台风列表"; this.tf.visible=true; } //台风年份数据绑定 [Bindable] private var arrYear:ArrayCollection=new ArrayCollection ([ {tfHappendTime:yearnow},{tfHappendTime:yearReduceOne},{tfHappendTime:yearReduceTwo},{tfHappendTime:yearReduceThree},{tfHappendTime:yearReduceFour}, {tfHappendTime:yearReduceFive},{tfHappendTime:yearReduceSix},{tfHappendTime:yearReduceSeven},{tfHappendTime:yearReduceEight},{tfHappendTime:yearReduceNine} ]); /** * 关闭事件 * @autor:hanhh * */ private function widgetClosedHandler(event:Event):void { graphicsLayer.clear(); tfInfoLayer.clear(); } ]]> </fx:Script> <fx:Declarations> <esri:PictureMarkerSymbol id="pic" source="@Embed(source='assets/images/tf.swf')"/> </fx:Declarations> <viewer:WidgetTemplate id="wTemplate" width="100%" height="100%" closed="widgetClosedHandler(event)"> <s:Label text="台风列表" id="title" height="20" paddingTop="5" paddingLeft="5"/> <mx:LinkButton height="20" width="20" id="backButton" click="openTfInfo(event)" icon="@Embed('widgets/ActualWeather/images/BACK.png')" visible="false" right="5"/> <s:VGroup id="tf" paddingBottom="5" paddingLeft="5" paddingRight="5" paddingTop="25" gap="5" horizontalAlign="center" width="98%" height="100%" visible="true" > <s:HGroup verticalAlign="middle" width="100%"> <!--根据年份选择台风下拉列表--> <s:Label text="选择查看的台风年份:" width="60%" fontFamily="宋体"/> <s:DropDownList id="tfYear_DropDownList" dataProvider="{arrYear}" labelField="tfHappendTime" close="dropDownYearList_closeHandler(event)" prompt="请选择台风年份" selectedIndex="0" width="40%"></s:DropDownList> </s:HGroup> <mx:DataGrid id="tfDataGrid" itemClick="tfitemClick(event)" doubleClickEnabled="true" width="100%" rowCount="12" dataProvider="{tfHistoryList}"> <mx:columns > <mx:DataGridColumn headerText="台风编号" minWidth="50" dataField="id"/> <mx:DataGridColumn headerText="台风名" minWidth="70" dataField="tfZhName" /> <mx:DataGridColumn headerText="强度" minWidth="90" dataField="tfqd" /> </mx:columns> </mx:DataGrid> </s:VGroup> <s:VGroup paddingBottom="5" paddingLeft="5" paddingRight="5" paddingTop="25" gap="5" horizontalAlign="center" id="tfDetail" visible="false" width="98%"> <s:HGroup width="100%"> <mx:DataGrid dataProvider="{tfData}" id="dataGrid" horizontalScrollPolicy="auto" verticalScrollPolicy="auto" rowCount="11" width="100%" > <mx:columns> <mx:DataGridColumn textAlign="center" headerText="台风时间" width="80" dataField="formatTF_TIME"/> <mx:DataGridColumn textAlign="center" headerText="经度(°)" width="50" dataField="tfLongitude"/> <mx:DataGridColumn textAlign="center" headerText="纬度(°)" width="50" dataField="tfLatitude"/> <mx:DataGridColumn textAlign="center" headerText="风速(m/s)" dataField="tfFs" width="50"/> <mx:DataGridColumn textAlign="center" headerText="气压(Pa)" dataField="tfQy" width="50"/> </mx:columns> </mx:DataGrid> </s:HGroup> <s:HGroup width="100%" paddingTop="5"> <mx:HRule width="100%" strokeWidth="2" alpha="0.5" id="qx" /> </s:HGroup> <s:HGroup width="100%" verticalAlign="middle" paddingBottom="0" > <s:Label text="播放速度:"/> <mx:HSlider minimum="0.1" maximum="0.4" value="0.4" dataTipPlacement="top" change="changeSpend(event)" tickColor="black" snapInterval="0.1" tickInterval="0.1" allowTrackClick="true" liveDragging="true" id="timeSelect" /> <s:Button id="playbutton" label="播放" width="60" click="button1_clickHandler(event)"/> </s:HGroup> </s:VGroup> </viewer:WidgetTemplate> </viewer:BaseWidget>
备注:
GIS技术交流QQ群:432512093
WebGIS二次开发培训入门群: 238339408

