Android统计图表MPAndroidChart:为多条统计折线动态更新数据,以高温低温曲线为例【7】
Android统计图表MPAndroidChart:为多条统计折线动态更新数据,以高温低温曲线为例【7】
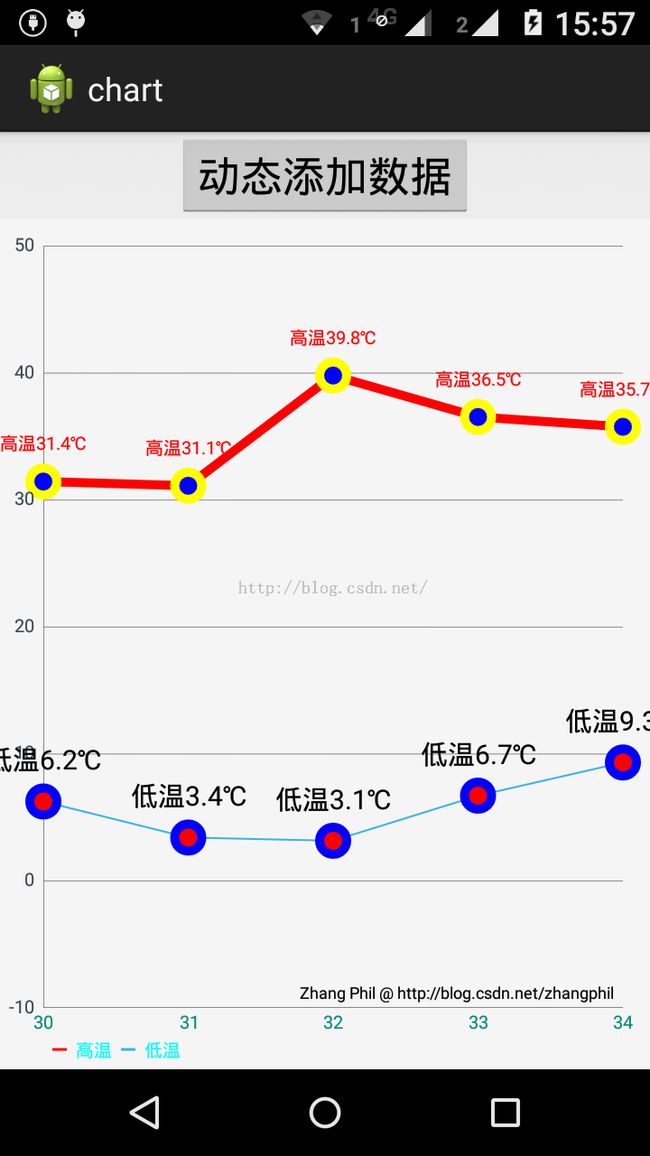
本文在附录文章6的基础上,为Android统计图表MPAndroidChart的同一个LineChart中同时增加两条统计折线,动态的为这两条折线同时增加数据并更新结果。典型的,以天气预报中的高温和低温线为例加以说明。
写布局文件:
<LinearLayout xmlns:android="http://schemas.android.com/apk/res/android"
    xmlns:tools="http://schemas.android.com/tools"
    android:layout_width="match_parent"
    android:layout_height="match_parent"
    android:orientation="vertical"
    tools:context="zhangphil.chart.MainActivity" >

    <Button
        android:id="@+id/button"
        android:layout_width="wrap_content"
        android:layout_height="wrap_content"
        android:layout_gravity="center_horizontal"
        android:text="动态添加数据" />

    <com.github.mikephil.charting.charts.LineChart
        android:id="@+id/chart"
        android:layout_width="match_parent"
        android:layout_height="match_parent" />

</LinearLayout>
Java代码:
package zhangphil.chart;

import java.text.DecimalFormat;

import com.github.mikephil.charting.charts.LineChart;
import com.github.mikephil.charting.components.Legend;
import com.github.mikephil.charting.components.XAxis;
import com.github.mikephil.charting.components.XAxis.XAxisPosition;
import com.github.mikephil.charting.components.YAxis.AxisDependency;
import com.github.mikephil.charting.components.YAxis;
import com.github.mikephil.charting.components.Legend.LegendForm;
import com.github.mikephil.charting.data.Entry;
import com.github.mikephil.charting.data.LineData;
import com.github.mikephil.charting.data.LineDataSet;
import com.github.mikephil.charting.formatter.ValueFormatter;
import com.github.mikephil.charting.utils.ColorTemplate;
import com.github.mikephil.charting.utils.ViewPortHandler;

import android.app.Activity;
import android.graphics.Color;
import android.os.Bundle;
import android.view.View;
import android.widget.Button;

public class MainActivity extends Activity {

	// 高温线下标
	private final int HIGH = 0;

	// 低温线下标
	private final int LOW = 1;

	@Override
	protected void onCreate(Bundle savedInstanceState) {
		super.onCreate(savedInstanceState);
		setContentView(R.layout.activity_main);

		final LineChart mChart = (LineChart) findViewById(R.id.chart);
		initialChart(mChart);
		addLineDataSet(mChart);

		// 每点击一次按钮,增加一个点
		Button addButton = (Button) findViewById(R.id.button);
		addButton.setOnClickListener(new View.OnClickListener() {

			@Override
			public void onClick(View v) {
				addEntry(mChart);
			}
		});
	}

	// 初始化图表
	private void initialChart(LineChart mChart) {
		mChart.setDescription("Zhang Phil @ http://blog.csdn.net/zhangphil");
		mChart.setNoDataTextDescription("暂时尚无数据");

		mChart.setTouchEnabled(true);

		// 可拖曳
		mChart.setDragEnabled(true);

		// 可缩放
		mChart.setScaleEnabled(true);
		mChart.setDrawGridBackground(false);

		mChart.setPinchZoom(true);

		// 设置图表的背景颜色
		mChart.setBackgroundColor(0xfff5f5f5);

		// 图表的注解(只有当数据集存在时候才生效)
		Legend l = mChart.getLegend();

		// 可以修改图表注解部分的位置
		// l.setPosition(LegendPosition.LEFT_OF_CHART);

		// 线性,也可是圆
		l.setForm(LegendForm.LINE);

		// 颜色
		l.setTextColor(Color.CYAN);

		// x坐标轴
		XAxis xl = mChart.getXAxis();
		xl.setTextColor(0xff00897b);
		xl.setDrawGridLines(false);
		xl.setAvoidFirstLastClipping(true);

		// 几个x坐标轴之间才绘制?
		xl.setSpaceBetweenLabels(5);

		// 如果false,那么x坐标轴将不可见
		xl.setEnabled(true);

		// 将X坐标轴放置在底部,默认是在顶部。
		xl.setPosition(XAxisPosition.BOTTOM);

		// 图表左边的y坐标轴线
		YAxis leftAxis = mChart.getAxisLeft();
		leftAxis.setTextColor(0xff37474f);

		// 最大值
		leftAxis.setAxisMaxValue(50f);

		// 最小值
		leftAxis.setAxisMinValue(-10f);

		// 不一定要从0开始
		leftAxis.setStartAtZero(false);

		leftAxis.setDrawGridLines(true);

		YAxis rightAxis = mChart.getAxisRight();
		// 不显示图表的右边y坐标轴线
		rightAxis.setEnabled(false);
	}

	// 为LineChart增加LineDataSet
	private void addLineDataSet(LineChart mChart) {
		LineData data = new LineData();

		data.addDataSet(createHighLineDataSet());
		data.addDataSet(createLowLineDataSet());

		// 数据显示的颜色
		// data.setValueTextColor(Color.WHITE);

		// 先增加一个空的数据,随后往里面动态添加
		mChart.setData(data);
	}

	// 同时为高温线和低温线添加进去一个坐标点
	private void addEntry(LineChart mChart) {

		LineData data = mChart.getData();

		data.addXValue((data.getXValCount()) + "");

		// 增加高温
		LineDataSet highLineDataSet = data.getDataSetByIndex(HIGH);
		float fh = (float) ((Math.random()) * 10 + 30);
		Entry entryh = new Entry(fh, highLineDataSet.getEntryCount());
		data.addEntry(entryh, HIGH);

		// 增加低温
		LineDataSet lowLineDataSet = data.getDataSetByIndex(LOW);
		float fl = (float) ((Math.random()) * 10);
		Entry entryl = new Entry(fl, lowLineDataSet.getEntryCount());
		data.addEntry(entryl, LOW);

		mChart.notifyDataSetChanged();

		// 当前统计图表中最多在x轴坐标线上显示的总量
		mChart.setVisibleXRangeMaximum(4);

		mChart.moveViewToX(data.getXValCount() - 4);
	}

	// 初始化数据集,添加一条高温统计折线
	private LineDataSet createHighLineDataSet() {

		LineDataSet set = new LineDataSet(null, "高温");
		set.setAxisDependency(AxisDependency.LEFT);

		// 折线的颜色
		set.setColor(Color.RED);
		set.setCircleColor(Color.YELLOW);
		set.setLineWidth(5f);
		set.setCircleSize(10f);
		// set.setFillAlpha(128);
		set.setCircleColorHole(Color.BLUE);
		set.setHighLightColor(Color.GREEN);
		set.setValueTextColor(Color.RED);
		set.setValueTextSize(10f);
		set.setDrawValues(true);

		set.setValueFormatter(new ValueFormatter() {
			@Override
			public String getFormattedValue(float value, Entry entry, int dataSetIndex,
					ViewPortHandler viewPortHandler) {
				DecimalFormat decimalFormat = new DecimalFormat(".0℃");
				String s = "高温" + decimalFormat.format(value);
				return s;
			}
		});

		return set;
	}

	// 初始化数据集,添加一条低温统计折线
	private LineDataSet createLowLineDataSet() {

		LineDataSet set = new LineDataSet(null, "低温");
		set.setAxisDependency(AxisDependency.LEFT);

		// 折线的颜色
		set.setColor(ColorTemplate.getHoloBlue());
		set.setCircleColor(Color.BLUE);
		set.setLineWidth(1f);
		set.setCircleSize(10f);
		// set.setFillAlpha(128);
		// set.setFillColor(ColorTemplate.getHoloBlue());
		set.setHighLightColor(Color.DKGRAY);
		set.setValueTextColor(Color.BLACK);
		set.setCircleColorHole(Color.RED);
		set.setValueTextSize(15f);
		set.setDrawValues(true);

		set.setValueFormatter(new ValueFormatter() {
			@Override
			public String getFormattedValue(float value, Entry entry, int dataSetIndex,
					ViewPortHandler viewPortHandler) {
				DecimalFormat decimalFormat = new DecimalFormat(".0℃");
				String s = "低温" + decimalFormat.format(value);
				return s;
			}
		});

		return set;
	}
}
运行结果动图展示动态效果:
一张静态截图展示更清晰的效果:
相关文章:
【1】《Android统计图表MPAndroidChart》链接地址:http://blog.csdn.net/zhangphil/article/details/47656521
【2】《基于Android MPAndroidChart实现腾讯QQ群数据统计报表核心功能》链接地址:http://blog.csdn.net/zhangphil/article/details/47685515
【3】《Android实现天气预报温度/气温折线趋势图》链接地址:http://blog.csdn.net/zhangphil/article/details/47702245
【4】《Android统计图表之柱状图(条形图)》链接地址:http://blog.csdn.net/zhangphil/article/details/47727913
【5】《Android MPAndroidChart之PieChart和数据结构以及模型【5】》链接地址:http://blog.csdn.net/zhangphil/article/details/50172817
【6】《Android统计图表MPAndroidChart:动态添加数据更新【6】》链接地址:http://blog.csdn.net/zhangphil/article/details/50185115
【7】MPAndroidChart在github上的项目主页:https://github.com/PhilJay/MPAndroidChart