给Zabbix一件华丽的衣服Grafana插件
Grafana插件:
Grafana是一个用Javascript写的开源的、功能丰富的Dashboard和图像编辑器,界面还是比较叼的,喜欢的可以试试。
一、下载Grafana插件
wget https://grafanarel.s3.amazonaws.com/builds/grafana-2.0.2-1.x86_64.rpm
rpm -ivh grafana-2.0.2-1.x86_64.rpm

yum -y install git         #用于下载grafana插件的php文档
git clone  https://github.com/alexanderzobnin/grafana-zabbix/

cp -rf grafana-zabbix/zabbix/ /usr/share/grafana/public/app/plugins/datasource/zabbix
二、编辑plugin.json
注:下面修改的username和password不仅有对Zabbix_Server数据库的读权限,并且有对Zabbix Web页面的读权限
- 修改username
- 修改password
vim /usr/share/grafana/public/app/plugins/datasource/zabbix/plugin.json
{
  "username": "show",
  "password": "show",
}
三、Mysql赋权用户和在Zabbix Web界面创建用户show
(1)、对Zabbix数据库用户赋权
mysql> grant all privileges on zabbix.* to 'show'@'localhost' identified by 'show';
mysql> grant all privileges on zabbix.* to 'show'@'192.168.0.216' identified by 'show';
mysql> flush privileges;
(2)、在Zabbix Web界面中添加用户show
单击Administrator,选择Users,Create User 由于这边是测试环境,你可以选择将Show用户添加到Administrator 如果想谨慎点,那么就创建一个group,并且给该group赋予read权限,再把User添加到group里面 例如:下面我把show用户添加到了Group show里面 user:show pass:show

四、验证Zabbix json配置档api_jsonrpc.php
至少在当前zabbix 2.5.0环境中,确保当前的这些信息已经存在
vim /usr/local/zabbix/php/api_jsonrpc.php

header( 'Access-Control-Allow-Origin: *' );
header( 'Access-Control-Allow-Headers: Content-Type' );
header( 'Access-Control-Allow-Methods: POST' );
header( 'Access-Control-Max-Age: 1000' );
if   ($_SERVER[ 'REQUEST_METHOD' ] ===  'OPTIONS' ) {
return ;
}

require_once dirname(__FILE__).'/include/func.inc.php';
require_once dirname(__FILE__).'/include/classes/core/CHttpRequest.php';
五、启动Grafana服务并且配置Grafana页面
Grafana默认port为3000
service grafana-server start

http://your_ip:3000
我们看到已经打开Grafana Web页面啦
Default Account
User:admin
Pass:admin
OK,你已经登录成功了? 好吧恭喜你!!
这个时候我们要做什么呢?
六、为Grafana添加数据库
进去之后点击左上角的Data Sources-->Add new
下面总共有三处设置- Add data source (添加数据库名称及类型)
- Http settings (设置zabbix api_json页面,不验证)
- Zabbix API detail (可以读取这些信息的Users)

七、创建Dashboards
单击左侧Dashboards--->选择Home--->左下角new(新添加一个Dashboards)
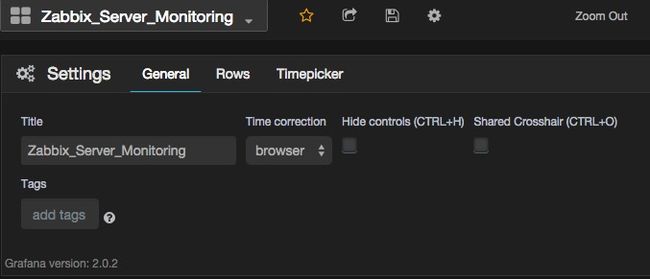
设置Dashboards的描述信息
我在这里命名为Zabbix_Server_Monitoring
点击settings左边的按钮保存即可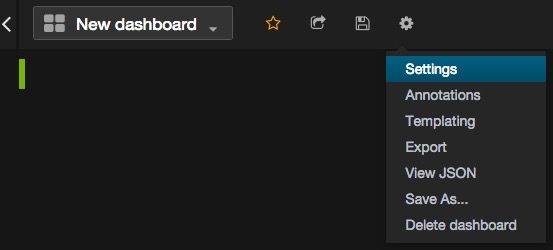
8、为Zabbix_Server_Monitoring添加Graphs
单击Zabbix_Server_Monitoring
点击左上角暗绿色的按钮
Add Panel
Graph
这时候界面中会出现 no database
单击'no title' 会弹出一个框,选择edit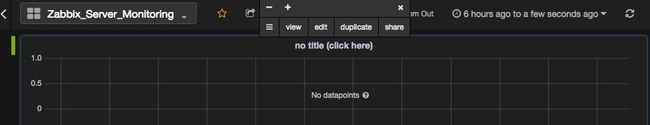
好,现在我们先点击General,设置基本信息
标题为 :Memoey_INFO
Span :6 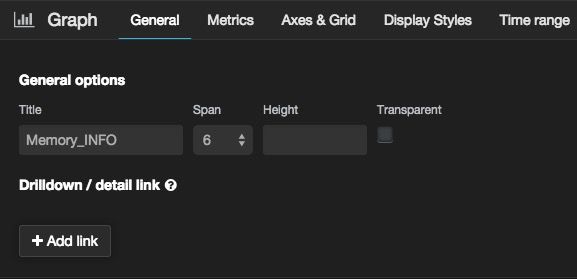
标题设置完了,我们来设置需要监控什么吧!
单击Metrics,把该监控的都填进去
注意了,这里选择需要通过Application,以前添加东西没习惯添加到Application的童鞋注意了,你会被坑到的~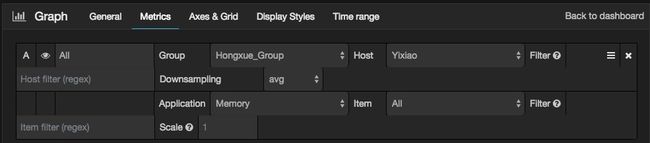
ok!!!,我在这边随便添加了几项信息,步骤和这个一样。
不过由于是测试环境,做的比较粗糙啦~