Html+Css JavaEE highChart使用指南:
对图表的一些设置
1. 图表的x轴 与 y轴互换,
图表反转 : 图表反转指的是将图表的 x轴和 y轴进行对调操作,对应的只需要设置 chart.inverted = true 即可。
示例:
<html>
<head>
   <script type="text/javascript" src="http://cdn.hcharts.cn/jquery/jquery-1.8.3.min.js"></script>
   <script type="text/javascript" src="http://cdn.hcharts.cn/highcharts/highcharts.js"></script>
   <script>
	$(function(){
		$('#container').highcharts({
			chart: {
				type: 'column',
				inverted: true
			},
			title: {
				text: 'Demo version 1.01'
			},
			yAxis: {
				/*categories: [1,2,3,4,5,6,7,8,,9,10],*/
				title: {
					text: 'go Ahead'
				}
			},
			xAxis: {
				categories: ['football', 'basketball', 'kkball']
			},
			series: [{
	            name: 'Jane',
	            data: [1, 0, 4]
	        }, {
	            name: 'John',
	            data: [5, 7, 3]
	        }]
		});
	})
   </script>
</head>

<body>
   <div id="container" style="min-width:800px;height:400px;"></div>
</body>
</html>
2.
6、数据标签(dataLables)
数据标签指的是在数据点上显示一些数据信息标签,对应的 API 为http://www.hcharts.cn/api/index.php#series.data.dataLabels
plotOptions: {
    line: {
        dataLabels: {
            enabled: true
        }
    }
}
数据标签默认显示当前数据点的点值,可以通过 formatter 函数或 format 来对其格式化。
plotOptions: {
    line: {
        dataLabels: {
            enabled: true,
            formatter: function() {
                return this.x + "	" + this.y;
            },
            // format: "{x} 	 {y}"
        }
    }
}
在线试一试
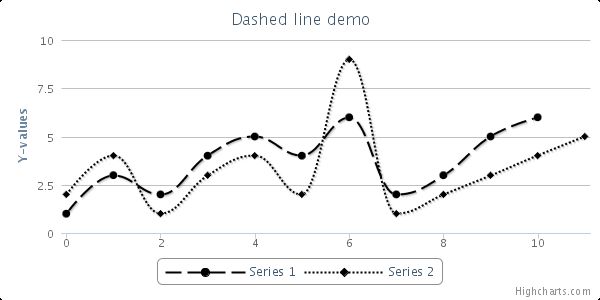
7、线条样式(Dash Style)
dashStyle 可以指定线条的样式
series: [{
    data: [1, 3, 2, 4, 5, 4, 6, 2, 3, 5, 6],
    dashStyle: 'longdash'
}]
在线试一试
