Scilab绘图函数(二)
1、contour2d,fcontour2d用于绘制三维表面的等高线
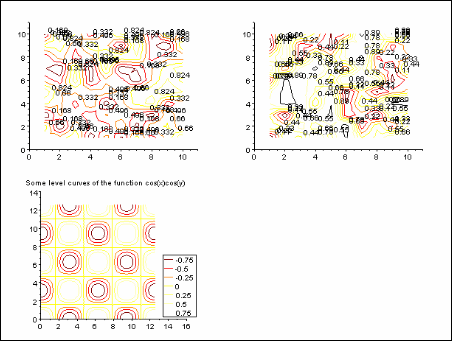
具体格式为:contour2d(x,y,z,nz, );x,y为格点,z为格点处的值,nz划分的等水平数,opt_args为style,strf,leg,rect,nax。
-->subplot(221);
-->contour2d(1:10,1:10,rand(10,10),5,rect=[0 0 11 11]);
-->xset("fpf","%.2f");
-->subplot(222);
-->contour2d(1:10,1:10,rand(10,10),8,rect=[0 0 11 11]);
-->x=linspace(0,4*%pi,80);
-->z=cos(x')*cos(x);
-->subplot(223);
-->f=gcf();
-->xset("fpf"," ");
-->f.color_map=hotcolormap(7);
-->contour2d(x,x,z,-0.75:0.25:0.75,frameflag=3,rect=[0,0,5*%pi,4*%pi]);
-->legends(string(-0.75:0.25:0.75),1:7,"lr");
-->xtitle("Some level curves of the function cos(x)cos(y)");
2、contour,fcountour在三维表面上绘出等高线
具体格式为:contour(x,y,z,nz, ),xy定义格点,z为格点上的值,nz为等高线数。
-->subplot(211);
-->t=linspace(-%pi,%pi,30);
-->function z=my_surface(x,y),z=x*sin(x)^2*cos(y),endfunction
-->contour(t,t,my_surface,10);
-->xset("fpf","%.1f");
-->subplot(212);
-->z=feval(t,t,my_surface);
-->plot3d(t,t,z);//绘制三维表面
-->contour(t,t,z+0.2*abs(z),20,flag=[0 2 4]);//绘制等高线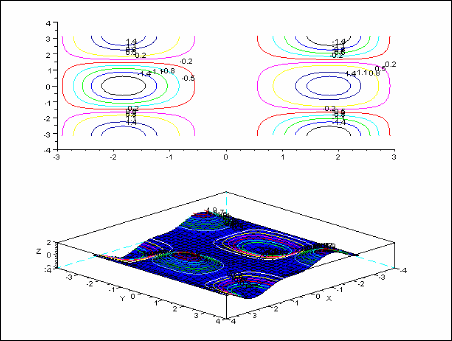
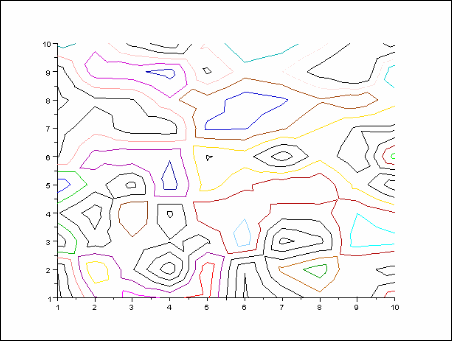
3、contour2di得到由坐标确定的等高线曲线
具体格式:[xc,yc]=contour2di(x,y,z,nz);xc,yc为等高曲线的坐标
-->[xc,yc]=contour2di(1:10,1:10,rand(10,10),5);//得到等高线坐标
-->k=1;n=yc(k);c=1;
-->while k+yc(k) -->n=yc(k);
-->plot2d(xc(k+(1:n)),yc(k+(1:n)),c)
-->c=c+1;
-->k=k+n+1;
-->end;
4、contourf用不同颜色填充等高线
具体格式:contourf(x,y,z,nz,[style,strf,leg,rect,nax])
-->contourf(1:10,1:10,rand(10,10),5,1:5,"011"," ",[0 0 11 11]); 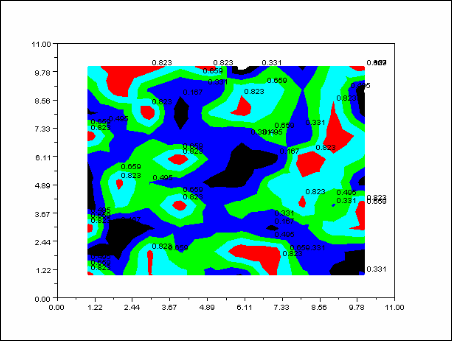 5、xarc绘制椭圆的一部分
具体格式:xarc(x,y,w,h,a1,a2);x,y,w,h定义椭圆,a1,a2定义个扇区。
xfarc填充椭圆的一部分
具体格式:xfarc(x,y,w,h,a1,a3);与xarc参数一样
xarcs绘制一组椭圆的一部分
具体格式:xarcs(arcs,[sytle]);arcs为一个6*n的矩阵,用于描述一组椭圆,style为1*n的向量,用于描述各个椭圆的风格
xfarcs填充一组椭圆的一部分;与xarcs参数一样
-->subplot(221);
-->plot2d(0,0,-1,"010"," ",[-2 -2 2 2]);
-->xarc(-1,1,2,2,0,90*64);
-->subplot(222);
-->plot2d(0,0,-1,"010"," ",[-2 -2 2 2]);
-->arcs=[-1 0 0.5;1 0 0.5;0.5 1 0.5;0.5 0.5 1;0 0 0;180*64 360*64 90*64];
-->xarcs(arcs,[1 2 3]);
-->subplot(223);
-->plot2d(0,0,-1,"010"," ",[-2 -2 2 2]);
-->xfarc(-0.5,0.5,1,1,0,90*64);
-->subplot(224);
-->plot2d(0,0,-1,"010"," ",[-2 -2 2 2]);
-->xfarcs(arcs,[1 2 3]);
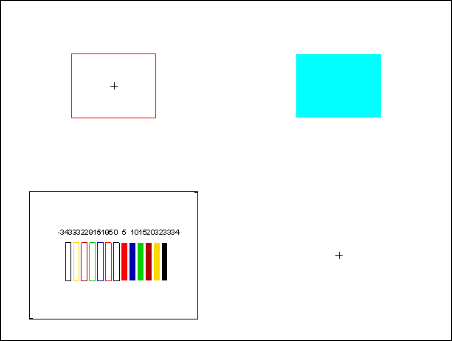
6、xrect绘制一个矩阵,xfrect绘制一个填充的矩形,xrects绘制一组矩形
-->subplot(221);
-->plot2d(0,0,-1,"010"," ",[-2 -2 2 2]);
-->xset("color",5);
-->xrect(-1,1,2,2);
-->subplot(222);
-->plot2d(0,0,-1,"010"," ",[-2 -2 2 2]);
-->xset("color",4);
-->xfrect(-1,1,2,2);
-->subplot(223);
-->plot2d([-100,500],[-50,50],[-1,-1],"022");
-->cols=[-34,-33,-32,-20:5:20,32,33,34];
-->x=400*(0:14)/14;step=20;
-->rects=[x;10*ones(x);step*ones(x);30*ones(x)];
-->xrects(rects,cols);
-->xnumb(x,15*ones(x),cols);
7、xpoly,xfpoly用于绘制多边形以及填充的多边形,而xpolys,xfpolys用于绘制多个多边形以及填充的多边形
function testofpoly
clf();
x=sin(2*%pi*(0:4)/5);
y=cos(2*%pi*(0:4)/5);
subplot(221);
plot2d(0,0,-1,"010"," ",[-2 -2 2 2]);
xset("color",5);
xpoly(x,y);
subplot(222);
plot2d(0,0,-1,"010"," ",[-2 -2 2 2]);
xset("color",4);
xpoly(x,y);
e=gce();
e.closed='off';
subplot(223);
plot2d(0,0,-1,"010"," ",[-2 -2 2 2]);
xfpoly(x,y);
subplot(224);
plot2d(0,0,-1,"010"," ",[-2 -2 2 2]);
xfpoly(x,y);
e=gce();
e.fill_mode='off';
e.closed='off'
endfunction
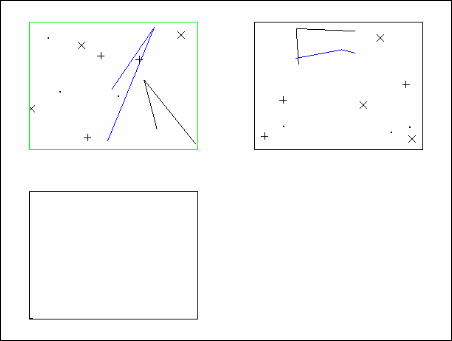
function testofpoly
clf();
subplot(221);
plot2d(0,0,-1,"012"," ",[0 0 1 1]);
rand("uniform");
xset("color",3);
xpolys(rand(3,5),rand(3,5),[-1 -2 0 1 2]);
subplot(222);
plot2d(0,0,-1,"012"," ",[0 0 1 1]);
xpolys(rand(3,5),rand(3,5),[-1 -2 0 1 2]);
subplot(223);
plot2d(0,0,-1,"012"," ",[0 0 1 1]);
x1=[0,10,20,30,20,10,0]';
y1=[15,30,30,15,0,0,15]';
xpols=[x1 x1 x1 x1];
xpols=xpols+[0 60 120 180].*.ones(x1);
ypols=[y1 y1 y1 y1];
xfpolys(xpols,ypols,[-1 0 1 2]);
endfunction
8、param3d用于绘制参数化曲线,param3d1也适用于绘制参数化曲线,但是它可以指定不同曲线的颜色。
具体格式为:param3d(x,y,z,[theta,alpha,leg,flag,ebox]),x,y,z为曲线的坐标点,其它参数为视角,外框等设置
function testofparam
t=0:0.1:5*%pi;
subplot(211);
param3d(sin(t),cos(t),t/10,35,45,"x@y@z",[2,3]);
e=gce();
e.foreground=color('red');
a=gca();
a.rotation_angles=[10 70];
subplot(212);
param3d1([sin(t),sin(2*t)],[cos(t),cos(2*t)],[t/10,sin(t)]);
endfunction
9、hist3d用于绘制三维直方图
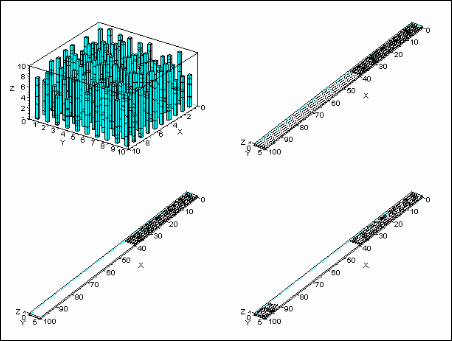
具体格式为:hist3d(f, )或hist3d(list(f,x,y), )
function testofhist3d
subplot(221);
hist3d(10*rand(10,10));
Z=zeros(100,5);
A=abs(rand(40,5));
Z(1:40,:)=A;
subplot(222);
hist3d(Z);
Index=find(Z==0);
Z(Index)=%nan;
subplot(223);
hist3d(Z);
A=abs(rand(10,5));
Z(91:100,:)=A;
subplot(224);
hist3d(Z);
endfunction
10、xrpoly绘制一个n边的多边形
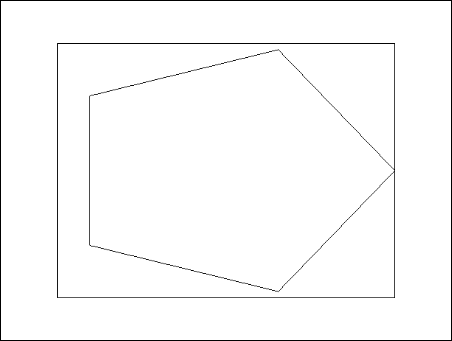
具体格式为:xrpoly(orig,n,r,[theta]),orig为原点位置,n为边数,r为直径,theta为角度。
function testofxrpoly
plot2d(0,0,-1,"012"," ",[0 0 10 10]);
xrpoly([5 5],5,5);
endfunction
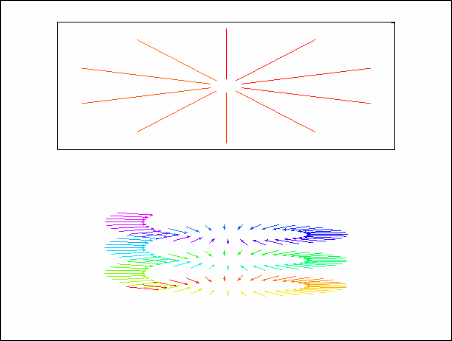
11、xsegs用于绘制没有相连的线段
具体格式为:xsegs(xv,yv,zv,[style]),xv,yv,zv为相同大小的矩阵,zv如果没有给出,默认为零。
function testofsegs
x=2*%pi*(0:9)/10;
xv=[sin(x);9*sin(x)];
yv=[cos(x);9*cos(x)];
subplot(211);
plot2d([-10,10],[-10,10],[-1,-1],"022");
xsegs(xv,yv,1:10);
subplot(212);
a=gca();
a.view="3d";
f=gcf();
f.color_map=rainbowcolormap(120);
alpha=2*%pi*(0:119)/40;
xv=[sin(alpha)/2;sin(alpha)/3];
yv=[cos(alpha)/2;cos(alpha)/3];
zv=[alpha/8;alpha/8];
xsegs(xv,yv,zv,1:120);
a.data_bounds=[min(xv) min(yv) min(zv);max(xv) max(yv) max(zv)];
e=gce();
e.arrow_size=0.4;
endfunction
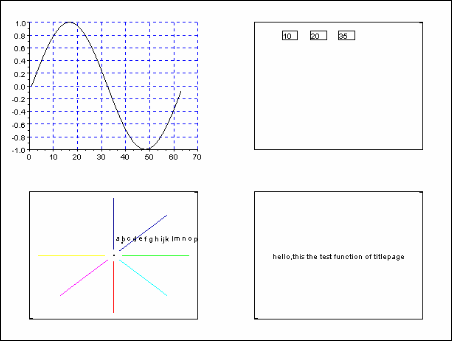
12、xgrid为二维图形增加格点
具体格式为:xgrid([style]),style为整数,定义格点的风格
xnumb绘制数值
具体格式为:xnumb(x,y,nums,[box,angle]);x,y,nums为大小相同的矢量,分别给出位置,数值
xstring绘制字符串
具体格式为:xstring(x,y,str,[angle,box]);x,y,str为大小相同的矢量,str为字符串
xarrows绘制一组箭头
具体格式为:xarrows(nx,ny,[arsize,style]);nx,ny为大小相同的矢量,arsize定义箭头头的大小,style定义风格。
titlepage在图形窗口中心添加一个标题
function testofsomfunc
clf();
subplot(221);
x=[0:0.1:2*%pi]';
plot2d(sin(x));
xgrid(2);
subplot(222);
plot2d([-100,500],[-100,600],[-1,-1],"022");
x=0:100:200;
xnumb(x,500*ones(x),[10,20,35],1);
subplot(223);
alphabet=["a" "b" "c" "d" "e" "f" "g" ..
"h" "i" "j" "k" "l" "m" "n" ..
"o" "p" "q" "r" "s" "t" "u" ..
"v" "w" "x" "y" "z"];
plot2d([0;1],[0;2],0);
xstring(0.1,1.8,alphabet);
subplot(223);
x=2*%pi*(0:9)/8;
x1=[sin(x);9*sin(x)];
y1=[cos(x);9*cos(x)];
plot2d([-10,10],[-10,10],[-1,-1],"022");
xset("clipgrf");
xarrows(x1,y1,1,1:10);
xset("clipoff");
subplot(224);
titlepage("hello,this the test function of titlepage");
endfunction
13、meshgrid用于建立网格
具体格式为:[X,Y,Z]=meshgrid(x,y,z),x,y,z为矢量,而X,Y,Z为矩阵
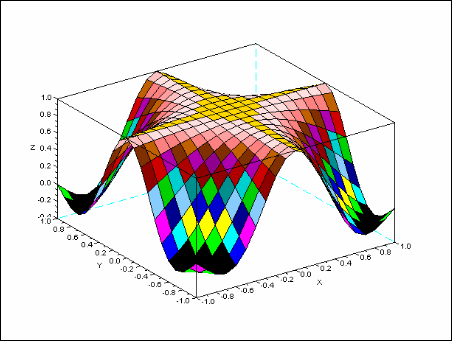
surf绘制三维表面
具体格式为:surf(Z,color, )或surf(X,Y,Z, , )
X,Y为两个实矩阵或向量,这些数据定义标准的格点,并且X,Y的分量必须与Z维数匹配,Z为表面的高度。
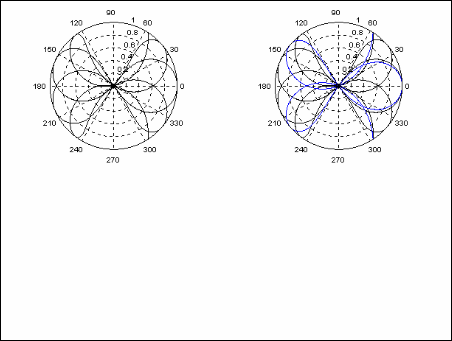
14、polarplot用于绘制极坐标
具体格式:polarplot(theta,rho, );theta为角度值,rho为半径值,opt_args定义坐标风格。
function testofpolarplot
clf();
t=0:0.01:2*%pi;
subplot(221);
polarplot(sin(7*t),cos(8*t))
subplot(222);
polarplot([sin(7*t') sin(6*t')],[cos(8*t') cos(8*t')],[1,2]);
endfunction
15、pie用于绘制饼图
具体格式为:pie(x[,sp[,txt]]),x为正整数,sp为实标量,txt为字符串
function testofpie
subplot(221);
pie([1 2 5]);
subplot(222);
pie([5 9 4 6 3],[0 1 0 1 0]);
subplot(223);
pie([3 4 6 2],[0 1 0 0],["part1","part2","part3","part4"]);
endfunction
