Basemap可视化地图信息
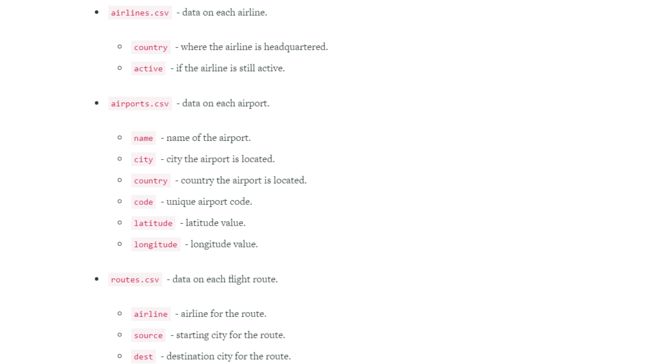
Dataset
- 在气象学和气候学中,地址数据十分重要,因此本文就是学会可视化地理数据。headquartered:总部所在地
我们可以根据这个数据探索很多有趣的问题:
- 对于每一个机场,他们最频繁的目的地是哪里?
- 哪一个城市关于机场和航线而言是中心枢纽?
Geographic Coordinate Systems(地理坐标系统)
Longitude values:经度[-180,180]
Latitude values:纬度[-90,90]
举两个例子:
- White House, Washington, DC{Latitude: 38.898166 Longitude: -77.036441}
- Alcatraz Island, San Francisco, CA{Latitude: 37.827122 Longitude: 122.422934}
为了方便表达和呈现,我们需要将球坐标系(三维)转换为笛卡儿坐标系(二维),需要利用地图投影(map projection),有很多投影方式可供选择,本文选择的是墨卡托投影(Mercator projection),因为它广泛应用于谷歌地图和苹果APP。
Basemap
Basemap 是Matplotlib 的一个扩展,使得Matplotlib更方便处理地理数据。
The matplotlib basemap toolkit is a library for plotting 2D data on maps in Python. Basemap does not do any plotting on it’s own, but provides the facilities to transform coordinates to one of 25 different map projections.Basemap makes it easy to convert from the spherical coordinate system (latitudes & longitudes) to the Mercator projection
首先Anaconda没有basemap这个工具包,需要自己安装,安装步骤如下:
打开Anaconda Prompt这个命令框
输入conda install basemap然后就会自动下载安装包(它有很多依赖包,因此安装时间有点长)
在输入Spyder中from mpl_toolkits.basemap import Basemap来检测安装是否成功在使用Basemap进行地理数据分析时分几个步骤:
对特定的地图投影创建一个新的Basemap实例
利用Basemap将球面坐标系转换为笛卡儿坐标
利用 Matplotlib和Basemap来个性化这个地图
show()函数显示这个地图
- 创建一个Basemap实例:
import matplotlib.pyplot as plt
from mpl_toolkits.basemap import Basemap
%matplotlib inline
m = Basemap(projection='merc',llcrnrlat=-80,urcrnrlat=80,llcrnrlon=-180,urcrnrlon=180)- 其中有些参数:
projection - the map projection.
llcrnrlat - latitude of lower left hand corner of the desired map domain (degrees).
urcrnrlat - latitude of upper right hand corner of the desired map domain (degrees).
llcrnrlon - longitude of lower left hand corner of the desired map domain (degrees).
urcrnrlon- longitude of upper right hand corner of the desired map domain (degrees).
球面坐标系转换为笛卡尔坐标系
import pandas as pd
airports = pd.read_csv('airports.csv')

m = Basemap(projection='merc', llcrnrlat=-80, urcrnrlat=80, llcrnrlon=-180, urcrnrlon=180)

# Convert from Series objects to List objects.
longitudes = airports["longitude"].tolist()
latitudes = airports["latitude"].tolist()

# Convert latitude and longitude to x and y coordinates.
x, y = m(longitudes, latitudes)

# Display original longitude values
print(longitudes[0:5])
# Display original latitude values
print(latitudes[0:5])
# Display x-axis coordinates
print(x[0:5])
# Display y-axis coordinates
print(y[0:5])
''' [145.39188100000001, 145.78870000000001, 144.295861, 146.72624199999998, 147.22004999999999] [-6.0816889999999999, -5.2070829999999999, -5.8267889999999998, -6.5698280000000002, -9.4433830000000007] [36181909.301050939, 36226033.539869711, 36060037.494937442, 36330283.404696316, 36385192.323177092] [14843790.192350345, 14941516.685582709, 14872287.531036133, 14789178.970177783, 14466473.84037962] '''
Generating A Scatter Plot
- 将airports的经纬度信息转化为坐标信息画出散点图
m = Basemap(projection='merc', llcrnrlat=-80, urcrnrlat=80, llcrnrlon=-180, urcrnrlon=180)
x, y = m(longitudes, latitudes)
# Use matplotlib to draw the points onto the map.
m.scatter(x, y, s=1)
plt.show()
Customizing The Plot Using Basemap
- 上面那个图的大陆海岸线都没有勾勒1出来,因此需要我们对这个图做一些个性化的设置:drawcoastlines() method.这个函数就是画海岸线的。
m = Basemap(projection='merc', llcrnrlat=-80, urcrnrlat=80, llcrnrlon=-180, urcrnrlon=180)
longitudes = airports["longitude"].tolist()
latitudes = airports["latitude"].tolist()
x, y = m(longitudes, latitudes)
m.scatter(x, y, s=1)
m.drawcoastlines()
plt.show()
Customizing The Plot Using Matplotlib
- 由于Basemap就是基于matplotlib的,因此如果对matplotlib很熟悉,可以直接利用matplotlib的个性化函数来定制你的图:
# 创建一个fig对象,自定义fig的size
fig = plt.figure(figsize=(15,20))
# 划分fig并且选择一个子图给ax变量
ax = fig.add_subplot(1,1,1)
# 给ax子图设置标题
ax.set_title("Scaled Up Earth With Coastlines")
# 创建一个Basemap实例
m = Basemap(projection='merc', llcrnrlat=-80, urcrnrlat=80, llcrnrlon=-180, urcrnrlon=180)
longitudes = airports["longitude"].tolist()
latitudes = airports["latitude"].tolist()
# 将经纬度转换为笛卡尔坐标
x, y = m(longitudes, latitudes)
m.scatter(x, y, s=1)
m.drawcoastlines()
plt.show()
Displaying Great Circles
- 因为routes文件只保存了airline 以及source和dest ,airlines中保存了country ,airport才保存了经纬度信息以及country ,因此通过country 可以将这三个文件关联起来,并且创建一个新的文件geo_routes.csv保存了每个route的起点终点的经纬度信息。
geo_routes = pd.read_csv("geo_routes.csv")
print(geo_routes.columns)
print(geo_routes.head(5))
''' Index(['airline', 'source', 'dest', 'equipment', 'start_lon', 'end_lon', 'start_lat', 'end_lat'], dtype='object') airline source dest equipment start_lon end_lon start_lat end_lat 0 2B AER KZN CR2 39.956589 49.278728 43.449928 55.606186 1 2B ASF KZN CR2 48.006278 49.278728 46.283333 55.606186 2 2B ASF MRV CR2 48.006278 43.081889 46.283333 44.225072 3 2B CEK KZN CR2 61.503333 49.278728 55.305836 55.606186 4 2B CEK OVB CR2 61.503333 82.650656 55.305836 55.012622 '''- 为了方便观察飞机的航线,我们可以在球面上从起到到终点画一个圈,在坐标系上就是一条直线。Basemap中一个专门画球面距离的函数drawgreatcircle():
lon1 - longitude of the starting point.
lat1 - latitude of the starting point.
lon2 - longitude of the ending point.
lat2 - latitude of the ending point.
fig = plt.figure(figsize=(15,20))
m = Basemap(projection='merc', llcrnrlat=-80, urcrnrlat=80, llcrnrlon=-180, urcrnrlon=180)
m.drawcoastlines()

def create_great_circles(df):
    for index, row in df.iterrows():
        start_lon = row['start_lon']
        start_lat = row['start_lat']
        end_lon = row['end_lon']
        end_lat = row['end_lat']

        if abs(end_lat - start_lat) < 180 and abs(end_lon - start_lon) < 180:
            m.drawgreatcircle(start_lon, start_lat, end_lon, end_lat, linewidth=1)
dfw = geo_routes[geo_routes['source'] == "DFW"]
create_great_circles(dfw)
plt.show()


