公式怕忘记了,做个记号
http://ieng9.ucsd.edu/~ma155f/animate.html
Animated Graphics in MATHEMATICA
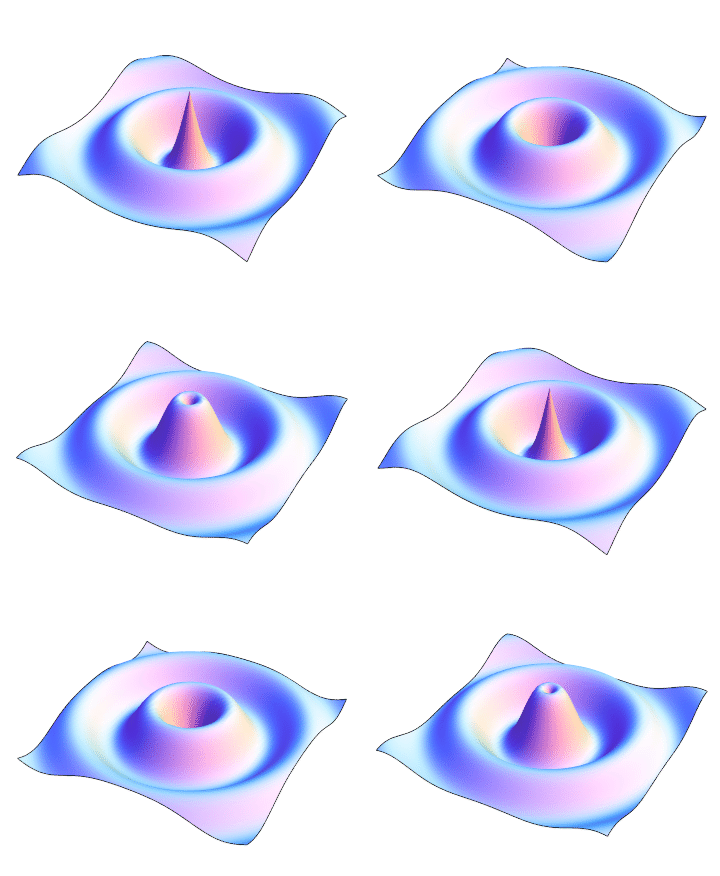
The animated graphic below was created by first drawing each individual picture using Mathematica, then saving the list of pictures as an animated gif.
picts = Table[
   Plot3D[Sin[x^2 + y^2 - i Pi/20], {x, -3 Pi/4, 3 Pi/4}, {y, -3 Pi/4,
      3 Pi/4}, PlotPoints -> 40, Axes -> False, Boxed -> False,
    Mesh -> None, PlotTheme -> "Classic", ImageSize -> 310], {i, 0,
    39}];
Export["testAnipic.gif", picts, "DisplayDurations" -> 0.075]
忘记上述公式之后,先是这样找:
Manipulate[Plot3D[BesselJ[0,Sqrt[x^2+y^2]+t],{x,-10,10},{y,-10,10},Axes->False,Mesh->None,PlotPoints->60,PlotRange->{-1/2,1},DisplayFunction->Identity,PlotTheme->{"Classic",Lighting->"ClassicLights"},Boxed->False],{t,0,11}]

但是发现不对; 还曾经这样找:
Manipulate[Plot3D[2Sin[Sqrt[x^2+y^2]+t+2]/(Sqrt[x^2+y^2]+2)(*/(x^2+y^2+1/1000000)*),{x,-10,10},{y,-10,10},Axes->False,Mesh->None,PlotPoints->60,PlotRange->{-1/2,1},DisplayFunction->Identity,PlotTheme->{"Classic",Lighting->"ClassicLights"},Boxed->False],{t,0,11}]

显然也是不对的。 还到matplotlib的在线document和example中找。。。。
所以,还是记下来比较方便。
