Percona Toolkit 使用
安装 percona-toolkit
   perl Makefile.PL
   make
   make test
   make install
默认安装到 /usr/local/bin 目录下
可能需要
DBI-1.632.tar.gz
DBD-mysql-4.033.tar.gz
ftp://ftp.funet.fi/pub/languages/perl/CPAN/modules/by-module/DBI/
安装方式同上
查看都安装了哪些命令
man percona-toolkit
查找重复索引:
pt-duplicate-key-checker -h10.1.152.60 -P3306 -uroot -proot --charset=utf8 --database=ucar
pt-query-digest使用
简单使用
pt-query-digest slow_log.sql
生成结果解释:
The default --output is a query analysis report. The --[no]report option controls whether or not this report is
printed. Sometimes you may want to parse all the queries but suppress the report, for example when using --review
or --history.
There is one paragraph for each class of query analyzed. A “class” of queries all have the same value for the
--group-by attribute which is fingerprint by default. (See “ATTRIBUTES”.) A fingerprint is an abstracted
version of the query text with literals removed, whitespace collapsed, and so forth. The report is formatted so it’s easy
to paste into emails without wrapping, and all non-query lines begin with a comment, so you can save it to a .sql file
and open it in your favorite syntax-highlighting text editor. There is a response-time profile at the beginning.
The output described here is controlled by --report-format. That option allows you to specify what to print and
in what order. The default output in the default order is described here.
The report, by default, begins with a paragraph about the entire analysis run The information is very similar to what
you’ll see for each class of queries in the log, but it doesn’t have some information that would be too expensive to keep
globally for the analysis. It also has some statistics about the code’s execution itself, such as the CPU and memory
usage, the local date and time of the run, and a list of input file read/parsed.
Following this is the response-time profile over the events. This is a highly summarized view of the unique events in
the detailed query report that follows. It contains the following columns:
Column Meaning
============ ==========================================================
Rank The query's rank within the entire set of queries analyzed
Query ID The query's fingerprint
Response time The total response time, and percentage of overall total
Calls The number of times this query was executed
R/Call The mean response time per execution
V/M The Variance-to-mean ratio of response time
Item The distilled query
A final line whose rank is shown as MISC contains aggregate statistics on the queries that were not included in the
report, due to options such as --limit and --outliers. For details on the variance-to-mean ratio, please see
http://en.wikipedia.org/wiki/Index_of_dispersion.
Next, the detailed query report is printed. Each query appears in a paragraph. Here is a sample, slightly reformatted
so ‘perldoc’ will not wrap lines in a terminal. The following will all be one paragraph, but we’ll break it up for
commentary.
# Query 2: 0.01 QPS, 0.02x conc, ID 0xFDEA8D2993C9CAF3 at byte 160665
This line identifies the sequential number of the query in the sort order specified by --order-by. Then there’s the
queries per second, and the approximate concurrency for this query (calculated as a function of the timespan and total
Query_time). Next there’s a query ID. This ID is a hex version of the query’s checksum in the database, if you’re
using --review. You can select the reviewed query’s details from the database with a query like SELECT ....
WHERE checksum=0xFDEA8D2993C9CAF3.
If you are investigating the report and want to print out every sample of a particular query, then the following
--filter may be helpful:
pt-query-digest slow.log \
--no-report \
--output slowlog \
--filter '$event->{fingerprint} \
&& make_checksum($event->{fingerprint}) eq "FDEA8D2993C9CAF3"'
Notice that you must remove the 0x prefix from the checksum.
Finally, in case you want to find a sample of the query in the log file, there’s the byte offset where you can look. (This
is not always accurate, due to some anomalies in the slow log format, but it’s usually right.) The position refers to the
worst sample, which we’ll see more about below.
Next is the table of metrics about this class of queries.
# pct total min max avg 95% stddev median
# Count 0 2
# Exec time 13 1105s 552s 554s 553s 554s 2s 553s
# Lock time 0 216us 99us 117us 108us 117us 12us 108us
# Rows sent 20 6.26M 3.13M 3.13M 3.13M 3.13M 12.73 3.13M
# Rows exam 0 6.26M 3.13M 3.13M 3.13M 3.13M 12.73 3.13M
The first line is column headers for the table. The percentage is the percent of the total for the whole analysis run,
and the total is the actual value of the specified metric. For example, in this case we can see that the query executed 2
times, which is 13% of the total number of queries in the file. The min, max and avg columns are self-explanatory. The
95% column shows the 95th percentile; 95% of the values are less than or equal to this value. The standard deviation
shows you how tightly grouped the values are. The standard deviation and median are both calculated from the 95th
percentile, discarding the extremely large values.
The stddev, median and 95th percentile statistics are approximate. Exact statistics require keeping every value seen,
sorting, and doing some calculations on them. This uses a lot of memory. To avoid this, we keep 1000 buckets,
each of them 5% bigger than the one before, ranging from .000001 up to a very big number. When we see a value
we increment the bucket into which it falls. Thus we have fixed memory per class of queries. The drawback is the
imprecision, which typically falls in the 5 percent range.
Next we have statistics on the users, databases and time range for the query.
# Users 1 user1
# Databases 2 db1(1), db2(1)
# Time range 2008-11-26 04:55:18 to 2008-11-27 00:15:15
The users and databases are shown as a count of distinct values, followed by the values. If there’s only one, it’s shown
alone; if there are many, we show each of the most frequent ones, followed by the number of times it appears.
# Query_time distribution
# 1us
# 10us
# 100us
# 1ms
# 10ms #####
# 100ms ####################
# 1s ##########
# 10s+
The execution times show a logarithmic chart of time clustering. Each query goes into one of the “buckets” and is
counted up. The buckets are powers of ten. The first bucket is all values in the “single microsecond range” – that is,
less than 10us. The second is “tens of microseconds,” which is from 10us up to (but not including) 100us; and so on.
The charted attribute can be changed by specifying --report-histogram but is limited to time-based attributes.
# Tables
# SHOW TABLE STATUS LIKE 'table1'\G
# SHOW CREATE TABLE `table1`\G
# EXPLAIN
SELECT * FROM table1\G
This section is a convenience: if you’re trying to optimize the queries you see in the slow log, you probably want to
examine the table structure and size. These are copy-and-paste-ready commands to do that.
Finally, we see a sample of the queries in this class of query. This is not a random sample. It is the query that performed
the worst, according to the sort order given by --order-by. You will normally see a commented # EXPLAIN line
just before it, so you can copy-paste the query to examine its EXPLAIN plan. But for non-SELECT queries that isn’t
possible to do, so the tool tries to transform the query into a roughly equivalent SELECT query, and adds that below.
If you want to find this sample event in the log, use the offset mentioned above, and something like the following:
tail -c +<offset> /path/to/file | head
See also --report-format.
默认数据库名:percona_schema
默认查询表名:query_review
默认历史表名:query_history
默认没有表会自动创建: --create-review-table/
数据库,表默认自动创建
保存review数据到db
#保存review结果
pt-query-digest  --user=root --password=root --review h=127.0.0.1,D=percona_schema,t=query_review --create-review-table  slow_query.sql

#简写
pt-query-digest  --user=root --password=root --review h=127.0.0.1 slow_query.sql
表结构:
CREATE TABLE `query_review` (
  `checksum` bigint(20) unsigned NOT NULL,
  `fingerprint` text NOT NULL,
  `sample` text NOT NULL,
  `first_seen` datetime default NULL,
  `last_seen` datetime default NULL,
  `reviewed_by` varchar(20) default NULL,
  `reviewed_on` datetime default NULL,
  `comments` text,
  PRIMARY KEY  (`checksum`)
) ENGINE=MyISAM DEFAULT CHARSET=latin1;
字段解释:
COLUMN       MEANING
=========== ====================================================
checksum   A 64-bit checksum of the query fingerprint
fingerprint The abstracted version of the query; its primary key
sample     The query text of a sample of the class of queries
first_seen  The smallest timestamp of this class of queries
last_seen   The largest timestamp of this class of queries
reviewed_by Initially NULL; if set, query is skipped thereafter
reviewed_on Initially NULL; not assigned any special meaning
comments   Initially NULL; not assigned any special meaning
保存数据到history表
pt-query-digest  --user=root --password=root --history h=127.0.0.1,D=percona_schema,t=query_history --create-review-table slow_query.sql

#简写
pt-query-digest  --user=root --password=root --history h=127.0.0.1 slow_query.sql
表结构
CREATE TABLE IF NOT EXISTS query_history (
    checksum BIGINT UNSIGNED NOT NULL,
    sample TEXT NOT NULL,
    ts_min DATETIME,
    ts_max DATETIME,
    ts_cnt FLOAT,
    Query_time_sum FLOAT,
    Query_time_min FLOAT,
    Query_time_max FLOAT,
    Query_time_pct_95 FLOAT,
    Query_time_stddev FLOAT,
    Query_time_median FLOAT,
    Lock_time_sum FLOAT,
    Lock_time_min FLOAT,
    Lock_time_max FLOAT,
    Lock_time_pct_95 FLOAT,
    Lock_time_stddev FLOAT,
    Lock_time_median FLOAT,
    Rows_sent_sum FLOAT,
    Rows_sent_min FLOAT,
    Rows_sent_max FLOAT,
    Rows_sent_pct_95 FLOAT,
    Rows_sent_stddev FLOAT,
    Rows_sent_median FLOAT,
    Rows_examined_sum FLOAT,
    Rows_examined_min FLOAT,
    Rows_examined_max FLOAT,
    Rows_examined_pct_95 FLOAT,
    Rows_examined_stddev FLOAT,
    Rows_examined_median FLOAT,
    -- Percona extended slowlog attributes
    -- http://www.percona.com/docs/wiki/patches:slow_extended
    Rows_affected_sum FLOAT,
    Rows_affected_min FLOAT,
    Rows_affected_max FLOAT,
    Rows_affected_pct_95 FLOAT,
    Rows_affected_stddev FLOAT,
    Rows_affected_median FLOAT,
    Rows_read_sum FLOAT,
    Rows_read_min FLOAT,
    Rows_read_max FLOAT,
    Rows_read_pct_95 FLOAT,
    Rows_read_stddev FLOAT,
    Rows_read_median FLOAT,
    Merge_passes_sum FLOAT,
    Merge_passes_min FLOAT,
    Merge_passes_max FLOAT,
    Merge_passes_pct_95 FLOAT,
    Merge_passes_stddev FLOAT,
    Merge_passes_median FLOAT,
    InnoDB_IO_r_ops_min FLOAT,
    InnoDB_IO_r_ops_max FLOAT,
    InnoDB_IO_r_ops_pct_95 FLOAT,
    InnoDB_IO_r_ops_stddev FLOAT,
    InnoDB_IO_r_ops_median FLOAT,
    InnoDB_IO_r_bytes_min FLOAT,
    InnoDB_IO_r_bytes_max FLOAT,
    InnoDB_IO_r_bytes_pct_95 FLOAT,
    InnoDB_IO_r_bytes_stddev FLOAT,
    InnoDB_IO_r_bytes_median FLOAT,
    InnoDB_IO_r_wait_min FLOAT,
    InnoDB_IO_r_wait_max FLOAT,
    InnoDB_IO_r_wait_pct_95 FLOAT,
    InnoDB_IO_r_wait_stddev FLOAT,
    InnoDB_IO_r_wait_median FLOAT,
    InnoDB_rec_lock_wait_min FLOAT,
    InnoDB_rec_lock_wait_max FLOAT,
    InnoDB_rec_lock_wait_pct_95 FLOAT,
    InnoDB_rec_lock_wait_stddev FLOAT,
    InnoDB_rec_lock_wait_median FLOAT,
    InnoDB_queue_wait_min FLOAT,
    InnoDB_queue_wait_max FLOAT,
    InnoDB_queue_wait_pct_95 FLOAT,
    InnoDB_queue_wait_stddev FLOAT,
    InnoDB_queue_wait_median FLOAT,
    InnoDB_pages_distinct_min FLOAT,
    InnoDB_pages_distinct_max FLOAT,
    InnoDB_pages_distinct_pct_95 FLOAT,
    InnoDB_pages_distinct_stddev FLOAT,
    InnoDB_pages_distinct_median FLOAT,
    -- Boolean (Yes/No) attributes. Only the cnt and sum are needed
    -- for these. cnt is how many times is attribute was recorded,
    -- and sum is how many of those times the value was Yes. So
    -- sum/cnt * 100 equals the percentage of recorded times that
    -- the value was Yes.
    QC_Hit_cnt FLOAT,
    QC_Hit_sum FLOAT,
    Full_scan_cnt FLOAT,
    Full_scan_sum FLOAT,
    Full_join_cnt FLOAT,
    Full_join_sum FLOAT,
    Tmp_table_cnt FLOAT,
    Tmp_table_sum FLOAT,
    Tmp_table_on_disk_cnt FLOAT,
    Tmp_table_on_disk_sum FLOAT,
    Filesort_cnt FLOAT,
    Filesort_sum FLOAT,
    Filesort_on_disk_cnt FLOAT,
    Filesort_on_disk_sum FLOAT,
PRIMARY KEY(checksum, ts_min, ts_max);
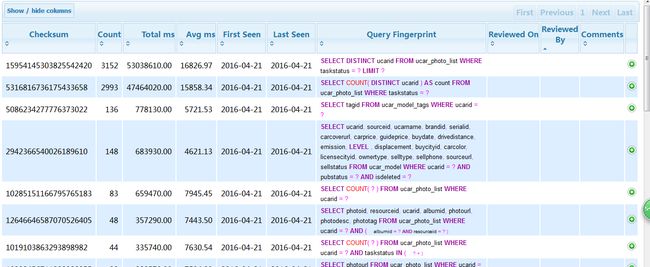
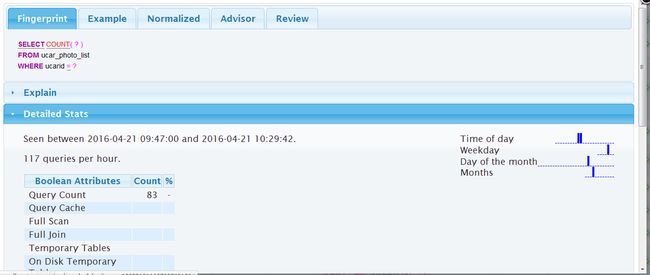
Query-Digest-UI 查看结果
1、配置独立域名
2、代码部署,重命名配置文件 cp config.php.example config.php,修改配置文件中的数据库名,表名,用户名,密码
3、用上面的命令生成结果后查看
另一款可视化工具 Box Anemometer,有兴趣的可以研究下
https://www.percona.com/blog/2012/08/31/visualization-tools-for-pt-query-digest-tables/

