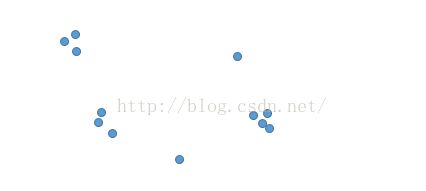
QT聚类(Quality Threshold Clustering)
本文主要介绍:QT聚类原理、优缺点及其实现。
1 聚类过程
比较简单的一种聚类方法,通过限定类额直径来聚类,大致过程如下
(1)设定聚类直径阈值D;
(2)以每一个样本为初始聚类中心,在特征空间,逐渐合并与之最近的样本,直到增加样本时,该类的直径将超过给定阈值D;直径D内的所有样本归为一类;
(3)以每个样本为初始中心聚类完成后,把样本最多的一类作为第一类,从样本中移除该类样本,余下样本继续进行2,直到所有样本都归类。
(4)根据每类样本个数,筛选真正的聚类中心,对于样本较少的类,可能是孤立点,可以舍弃。
2 优缺点:
优点:不需要指定聚类中心与聚类数目,是一种确定性算法;
缺点:每次都以每个样本为初始中心聚类,选择样本最多的类作为新产生的类,计算复杂,迭代次数多;通过直径D确定类的范围,不能识别数据集中合理的边界,只适用于某些特定聚类。
一般适合样本整体比较分散,少数样本比较集中的情况:
如:目标检测中,可以提取到目标中的几个关键点或角点,可以对这些关键点聚类,判断哪些点是属于一个目标的,同时可以去除一些孤立虚警点。
3 实现过程:
function idx=qtclusteuclid(G,d,D)
% QT clustering algorithm as described in:
%
% Heyer, L. J., Kruglyak, S., Yooseph, S. (1999). Exploring expression
% data: Identification and analysis of coexpressed genes. Genome Research
% 9, 1106–1115.
%
% http://genome.cshlp.org/content/9/11/1106.full
% http://genome.cshlp.org/content/9/11/1106/F5.large.jpg
%
% if two sets A{i} have same cardinality, we pick first one
% our distance measure is Euclidean distance
%
% input:
% G-nxp data to cluster 样本数据
% d-diameter threshold 直径阈值
% D-Euclidean distance for all 0<i<j<=n 样本两两间的距离,可以缺省
%
% output:
% idx-nx1 vector containing cluster indices
%
% Misha Koshelev
% January 20th, 2009
% Montague Laboratory

    n=size(G,1);
    if n<=1  %当剩下样本数小于1时,则结束聚类
        idx=ones(n,1);
        return;
    end
    if nargin<3   %求任意两个点之间的距离
        D=Inf*ones(n,n);
        for i=1:n
            D(i,i)=0;
            for j=i+1:n  %欧式距离
                D(i,j)=sqrt(sum((G(i,:)-G(j,:)).^2));D(j,i)=D(i,j);
            end
        end
    end

    C=[];Ccard=0;Cdiam=0;
    for i=1:n
        flag=true;
        A=[i];Acard=1;Adiam=0;
        while flag&&length(A)<n
            pts=1:n;pts(A)=[];
            jdiam=zeros(length(pts),1);
            for pidx=1:length(pts)
                % We only need to compute maximal distance from new point j to all
                % existing points in cluster
                jdiam(pidx)=max(D(pts(pidx),A));  %取每个样本与该类所有样本距离的最大值,如果最大值大于直径,
            end                                   %则表示该样本不可能与该类样本处于直径为d的圆中

            [minjdiam,pidx]=min(jdiam);j=pts(pidx); %j表示最大值中,最小的距离对应的样本
            if sum(jdiam==minjdiam)>1
                dbstack;keyboard;
            end

            if max(Adiam,minjdiam)>d  %当前其他样本与该类中某个样本距离大于直径,则结束
                flag=false;
            else
                A=[A,j];
                Acard=Acard+1;  %类内样本个数累加
                Adiam=max(Adiam,minjdiam);   %当前类内,最大距离
            end
        end

        A=sort(A);
        if Acard>Ccard  %该类样本个数大于之前,则更新,保证新产生的类为样本最多的类
            C=A;
            Ccard=Acard; %样本最多类的样本数
            Cdiam=Adiam; %样本最多类的最远距离
        end
    end

    idx=ones(n,1);
    GmC=1:n;GmC(C)=[];
    idx(GmC)=qtclusteuclid(G(GmC,:),d,D(GmC,GmC))+1;  %最多的为一类,余下的继续聚类,类别号累加

function d=diam(G,clust,D)
% http://thesaurus.maths.org/mmkb/entry.html?action=entryByConcept&id=3279
% The largest distance between any two points in a set is called the  set's diameter.
%
% input:
% G-nxp data for our cluster
% clust-vector of row indices into G
% D-Euclidean distance for all 0<i<j<=n
%

    d=0;
    for k=1:length(clust)-1
        d=max(d,max(D(clust(k),clust(k+1:end))));
    end
程序下载:http://download.csdn.net/detail/hong__fang/9459084
