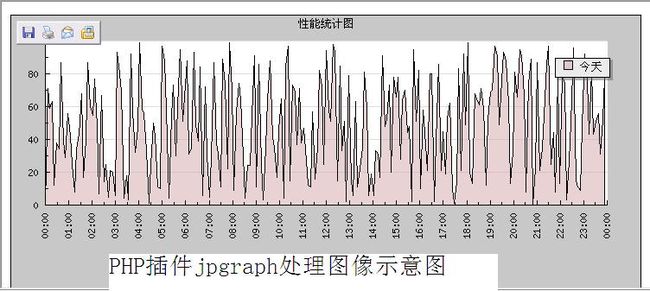
两种方式处理图表【php插件之jpgraph】【open-flash-chart】
这几天在工作中,用到了图表,了解了两种方法处理图表,供大家参考下:共同学习哦:
注:1.用到了jquer插件,2.有时间选择处理部分【可省略】
1.php插件之jpgraph
diaplay.php
<!DOCTYPE HTML PUBLIC "-//W3C//DTD HTML 4.01 Transitional//EN"
"http://www.w3.org/TR/html4/loose.dtd">
<html>
<head>
<title>Display</title>
<link rel="stylesheet" href="../style/style.css"/>
<link rel="stylesheet" href="../style/style.css"/>
<link rel="stylesheet" href="../style/jquery-ui-1.7.custom.css"/>
<link rel="stylesheet" type="text/css" href="../style/greybox.css"/>
<script type="text/javascript" src="../js/jquery-1.3.1.js"></script>
<script type="text/javascript" src="../js/jquery-ui-1.7.custom.min.js"></script>
<script type="text/javascript" src="../js/greybox.js"></script>
</head>
<script>
// GreyBox
$(document).ready(function(){
$('#select_date_from').datepicker();
$('#select_date_to').datepicker();
});
function loadIFrame()
{
var selectTime=$("input[name='selectTime']:checked").val();
if(selectTime=="selectday")
{
var from=$("#select_date_from").val();
var to=$("#select_date_to").val();
if(from=="" || to=="")
{
alert("请选择你要查询的时间!!");
return false;
}
$("#loadIFrame").attr("src","loadGraph.php?selectTime="+selectTime+"&from="+from+"&to="+to);
$("#select_date_from").val("");
$("#select_date_to").val("");
}
else
{
$("#loadIFrame").attr("src","loadGraph.php?selectTime="+selectTime);
}
}
</script>
<body>
<div style="width:97%;">
<b>性能显示</b>
<span style="text-align:right;width:90%"><a href="javascript:history.go(-1);">【返回】</a></span>
<div style="width:100%;height:20px; border:1px solid gray; background-color:#99CCFF;">时间选择</div>
<div style="width:100%;height:40px; border:1px solid gray; background-color:#CCCCCC;">
<table style="width:100%; ">
<tr>
<td><input name="selectTime" value="today" checked="checked" type="radio">今天</td>
<td><input name="selectTime" value="yesterday" type="radio">昨天</td>
<td><input name="selectTime" value="selectday" type="radio">
从 <input name="from" size="16" id="select_date_from" type="text" readonly>
<script>//$('#select_date_from').datepicker();</script>
到<input name="to" size="16" id="select_date_to" type="text" readonly>
<script>//$('#select_date_to').datepicker();</script>
<input name="Submit" value="显示" class="button" type="submit" onClick="loadIFrame();">
</td></tr>
</table>
</div>
<br>
<div style="width:100%;height:20px; border:1px solid gray; background-color:#99CCFF;">图形显示</div>
<div style="width:100%;height:250px; border:1px solid gray; background-color:#CCCCCC;text-align:center;">
<br>
<iframe src="loadGraph.php" width="99%" height="335" align="middle" id="loadIFrame"></iframe>
<br>
</div>
</div>
</body>
</html>
loadGraph.php
<?php
require_once("../lib/jpgraph-2.3.4/src/jpgraph.php");
require_once("../lib/jpgraph-2.3.4/src/jpgraph_line.php");
require_once("../lib/jpgraph-2.3.4/src/jpgraph_date.php");
// Create a data set in range (50,70) and X-positions
$dataPoints=250; //图表中点的个数【也就是记录的总数】
$totalSeconds=0; //要查询总秒数
$legendString="今天"; //legend 提示信息
//now
$dateArray=getdate();
$year=$dateArray['year'];
$month=$dateArray['mon'];
$day=$dateArray['mday'];
$hour=0;
$minute=0;
$second=0;
$selectTime=trim($_GET['selectTime']);
$from=trim($_GET['from']);
$to=trim($_GET['to']);
if($selectTime=="selectday")
{
$legendString=$from." ".$to; //legend 提示信息
$tempArray=explode("/",$from); // 月/日/年
$tempYear=$tempArray[2];
$tempMonth=$tempArray[0];
$tempDay=$tempArray[1];
$tempHour=0;
$tempMinute=0;
$tempSecond=0;
$start = mktime($tempHour,$tempMinute,$tempSecond,$tempMonth,$tempDay,$tempYear);
$tempArray=explode("/",$to); // 月/日/年
$tempYear=$tempArray[2];
$tempMonth=$tempArray[0];
$tempDay=$tempArray[1];
$tempHour=0;
$tempMinute=0;
$tempSecond=0;
$end = mktime($tempHour,$tempMinute,$tempSecond,$tempMonth,$tempDay,$tempYear);
$totalSeconds=$end-$start;
}
else if($selectTime=="yesterday")
{
$legendString="昨天"; //legend 提示信息
$totalSeconds=24*60*60;
$start = mktime($hour,$minute,$second,$month,$day,$year);
$start = $start - $totalSeconds;
$end = $start+$totalSeconds;
}
else
{
$legendString="今天"; //legend 提示信息
$totalSeconds=24*60*60;
$start = mktime($hour,$minute,$second,$month,$day,$year);
$end = $start+$totalSeconds;
}
//sql 处理部分
$data = array();
$xdata = array();
for( $i=0; $i < $dataPoints; ++$i ) {
$data[$i] = rand(0,100);
$xdata[$i] = $start + $totalSeconds*($i/$dataPoints);
}
// Create the new graph
$graph = new Graph(730,330);
// Slightly larger than normal margins at the bottom to have room for
// the x-axis labels
$graph->SetMargin(40,40,30,110);
// Fix the Y-scale to go between [0,100] and use date for the x-axis
$graph->SetScale('datlin',0,100,$start,$end);
$graph->title->SetFont(FF_SIMSUN,FS_NORMAL);
$graph->title->Set("性能统计图");
// Set the angle for the labels to 90 degrees
$graph->xaxis->SetLabelAngle(90);
$line = new LinePlot($data,$xdata);
$graph->legend->SetFont(FF_SIMSUN,FS_NORMAL);
$line->SetLegend($legendString);
$line->SetFillColor('[email protected]');
$graph->Add($line);
$graph->Stroke();
?>
2.open-flash-chart 处理图表
display2.php
<!DOCTYPE HTML PUBLIC "-//W3C//DTD HTML 4.01 Transitional//EN"
"http://www.w3.org/TR/html4/loose.dtd">
<html>
<head>
<title>Display</title>
<link rel="stylesheet" href="../style/style.css"/>
<link rel="stylesheet" href="../style/style.css"/>
<link rel="stylesheet" href="../style/jquery-ui-1.7.custom.css"/>
<link rel="stylesheet" type="text/css" href="../style/greybox.css"/>
<script type="text/javascript" src="../js/jquery-1.3.1.js"></script>
<script type="text/javascript" src="../js/jquery-ui-1.7.custom.min.js"></script>
<script type="text/javascript" src="../js/greybox.js"></script>
</head>
<script>
// GreyBox
$(document).ready(function(){
$('#select_date_from').datepicker();
$('#select_date_to').datepicker();
loadIFrame();
});
function loadIFrame()
{
var time=new Date().getMilliseconds();
var selectTime=$("input[name='selectTime']:checked").val();
if(selectTime=="selectday")
{
var from=$("#select_date_from").val();
var to=$("#select_date_to").val();
if(from=="" || to=="")
{
alert("请选择你要查询的时间!!");
return false;
}
$("#loadIFrame").load("loadGraph2.php?selectTime="+selectTime+"&from="+from+"&to="+to+"&time="+time);
$("#select_date_from").val("");
$("#select_date_to").val("");
}
else
{
$("#loadIFrame").load("loadGraph2.php?selectTime="+selectTime+"&time="+time);
}
}
</script>
<body>
<div style="width:97%;">
<b>性能显示</b>
<span style="text-align:right;width:90%"><a href="javascript:history.go(-1);">【返回】</a></span>
<div style="width:100%;height:20px; border:1px solid gray; background-color:#99CCFF;">时间选择</div>
<div style="width:100%;height:40px; border:1px solid gray; background-color:#CCCCCC;">
<table style="width:100%; ">
<tr>
<td><input name="selectTime" value="today" checked="checked" type="radio">今天</td>
<td><input name="selectTime" value="yesterday" type="radio">昨天</td>
<td><input name="selectTime" value="selectday" type="radio">
从 <input name="from" size="16" id="select_date_from" type="text" readonly>
<script>//$('#select_date_from').datepicker();</script>
到<input name="to" size="16" id="select_date_to" type="text" readonly>
<script>//$('#select_date_to').datepicker();</script>
<input name="Submit" value="显示" class="button" type="submit" onClick="loadIFrame();">
</td></tr>
</table>
</div>
<br>
<div style="width:100%;height:20px; border:1px solid gray; background-color:#99CCFF;">图形显示</div>
<div style="width:100%;height:250px; border:1px solid gray; background-color:#CCCCCC;text-align:center;">
<br>
<div id="loadIFrame"></div>
<br>
</div>
</div>
</body>
</html>
loadGraph2.php
<meta http-equiv="Expires" CONTENT="0">
<meta http-equiv="Cache-Control" CONTENT="no-cache">
<meta http-equiv="Pragma" CONTENT="no-cache">
<?php
$queryString=$_SERVER['QUERY_STRING'];
include_once '../lib/ofc-library/open_flash_chart_object.php';
open_flash_chart_object( 880, 250, 'line2.php?'.$queryString."&time=".time());
?>
line2.php
<?php
/**
* 图表数据处理页面
*
* 注:时间采集要就
*
* 五分钟收集一次数据
*
* 24*60*60/(5*60)=24*12
*
* 则$dataPoints=24*12;
* $xStep=12;
*
* @auther zwc
*/
include_once ('../service/mysql_conn.php');
include_once('../lib/ofc-library/open-flash-chart.php');
FUN_Connect_Mysql();
$time=$_GET['time'];
$dataPoints=24*12; //图表中点的个数【也就是记录的总数】
$totalSeconds=0; //要查询总秒数
$legendString="今天"; //legend 提示信息
$xDateFormate="Y-n-j H:i:s"; //x轴日期格式化标准
$xStep=12; //x轴步调
$data = array(); //图表显示数据
$links = array(); //点击图像的连接
$labels = array(); //x轴属性
//********************************时间处理部分**************************************
//now
$dateArray=getdate();
$year=$dateArray['year'];
$month=$dateArray['mon'];
$day=$dateArray['mday'];
$hour=0;
$minute=0;
$second=0;
$selectTime=trim($_GET['selectTime']);
$from=trim($_GET['from']);
$to=trim($_GET['to']);
if($selectTime=="selectday")
{
$tempArray=explode("/",$from); // 月/日/年
$tempYear=$tempArray[2];
$tempMonth=$tempArray[0];
$tempDay=$tempArray[1];
$tempHour=0;
$tempMinute=0;
$tempSecond=0;
$start = mktime($tempHour,$tempMinute,$tempSecond,$tempMonth,$tempDay,$tempYear);
$tempArray=explode("/",$to); // 月/日/年
$tempYear=$tempArray[2];
$tempMonth=$tempArray[0];
$tempDay=$tempArray[1];
$tempHour=0;
$tempMinute=0;
$tempSecond=0;
$end = mktime($tempHour,$tempMinute,$tempSecond,$tempMonth,$tempDay,$tempYear);
$totalSeconds=$end-$start;
$legendString=date("Y-n-j",$start)." ".date("Y-n-j",$end); //legend 提示信息
$xDateFormate="Y-n-j";
}
else if($selectTime=="yesterday")
{
$legendString="昨天"; //legend 提示信息
$xDateFormate="H:i:s";
$totalSeconds=24*60*60;
$start = mktime($hour,$minute,$second,$month,$day,$year);
$start = $start - $totalSeconds;
$end = $start+$totalSeconds;
}
else
{
$legendString="今天"; //legend 提示信息
$xDateFormate="H:i:s";
$totalSeconds=24*60*60;
$start = mktime($hour,$minute,$second,$month,$day,$year);
$end = $start+$totalSeconds;
}
//********************************数据库操作部分************************************************
$rq2 = "
SELECT cbsd.*
FROM cim_computersystem as ccs
Inner Join cim_elementstatisticaldata_array ON ccs.computerSystemID = cim_elementstatisticaldata_array.computerSystemID
Inner Join cim_blockstoragestatisticaldata as cbsd ON cim_elementstatisticaldata_array.blockStorageStatisticalDataID = cbsd.blockStorageStatisticalDataID
WHERE ccs.computerSystemID = '17034' and cbsd.statisticTime>='2010-03-25 05:09:26' order by cbsd.statisticTime asc";
$query = query($rq2);
$temp=mysql_num_rows($query);
while ($fetchArray = fetchRow($query)){
//$data[]=$fetchArray['totalIos'];
//$links[]=$fetchArray['statisticTime'].":".$fetchArray['totalIos'];
//$labels[]=$fetchArray['statisticTime'];
}
//****************************open-flash-chart部分******************************************
//生成随机数据 生成x轴数据
for( $i=0; $i <= $dataPoints; ++$i ) {
$data[$i] = rand(0,$time);
$links[$i]="javascript:alert('hello, i am no."+($i+1)+"')";
$labels[$i] = date($xDateFormate,$start + $totalSeconds*($i/$dataPoints));
}
//创建图形对象
$g = new Graph();
//设置标题
// Spoon sales, March 2007
$g->title($legendString."的统计图", "{font-size: 25px;}");
//将数据对象添加到图形对象上
$g->set_data($data);
//设置图例
$g->line(2, "0x9933CC", $legendString, 10, 2);
$g->line_hollow("2", "4", "0x80a033", "Bounces", "10");
$g->line_dot("5", "5", "0x006699");
//将链接对象添加到图形对象上
$g->set_links($links);
//设置X轴座标
// label each point with its value
// $labels[]="一月";
//设置X轴属性
$g->set_x_labels($labels);
$g->set_x_label_style("12", "#FF0000", 2,$xStep, "");
$g->set_x_legend("时间", 12, "#736AFF");
$g->set_x_axis_steps(2);
// set the Y max
//设置y轴属性
$g->set_y_max($time);//设置最大长度
// label every 20 (0,20,40,60)
//$g->y_label_steps(6);//设置步长
//输出
echo $g->render();//输出图形
?>
