Theano入门——MNIST数据库
Theano入门——MNIST数据库
1. MNIST数据库的文件格式
train-images-idx3-ubyte: 训练图像集
train-labels-idx1-ubyte: 训练标签集
t10k-images-idx3-ubyte:  测试图像集
t10k-labels-idx1-ubyte:  测试标签集
训练集包含60000个例子,测试集包含10000个例子。
[偏移] [类型]           [数值]           [描述]
0000   32位整数         0x00000801(2049) 幻数(MSB first)
0004   32位整数         60000            样本总数
0008   unsigned byte    ??               标签
0009   unsigned byte    ??               标签
........
xxxx   unsigned byte    ??               标签
[偏移]  [类型]          [数值]           [描述]
0000    32位整数        0x00000803(2051) 幻数
0004    32位整数        60000            图像总数
0008    32位整数        28               图像行数
0012    32位整数        28               图像列数
0016    unsigned byte   ??               像素
0017    unsigned byte   ??               像素
........
xxxx     unsigned byte  ??               像素
像素逐行组织。像素值为0到255。0为背景(白色),255为前景(黑色)。
[偏移]   [类型]         [数值]           [描述]
0000     32位整数       0x00000801(2049) 幻数(MSB first)
0004     32位整数       10000            样本总数
0008     unsigned byte  ??               标签
0009     unsigned byte  ??               标签
........
xxxx     unsigned byte  ??               标签
标签值为0到9。
[偏移]   [类型]         [数值]           [描述]
0000     32位整数       0x00000803(2051) 幻数
0004     32位整数       10000            图像总数
0008     32位整数       28               图像行数
0012     32位整数       28               图像列数
0016     unsigned byte  ??               像素
0017     unsigned byte  ??               像素
........
xxxx     unsigned byte  ??               像素
像素逐行组织。像素值为0到255。0为背景(白色),255为前景(黑色)。
2.IDX文件格式
幻数
0维大小
1维大小
2维大小
.....
N维大小
数据
幻数为1个整数(MSB first),它的前两个字节总是0。
第3个字节码为数据类型:
0x08: unsigned byte
0x09: signed byte
0x0B: short (2 bytes)
0x0C: int (4 bytes)
0x0D: float (4 bytes)
0x0E: double (8 bytes)
第4个字节码为向量或矩阵的维数:1为向量,2为矩阵,...
每维的大小为4字节整数(MSB first,high endian)。
3.加载数据库
(1)MNIST数据库文件夹mnist存放在相对文件路径datasets_dir下。
(2)mnist函数
训练图像文件的16个字节后为像素数据(16字节前为幻数和数据各维的大小),将逐行排序的像素变形为行数为60000,列数为28*28的矩阵trX。最后像素的数据类型定为浮点型;训练标签文件的8个字节后为标签数据,将逐行排序的标签变形为行数为60000,列数为1的矩阵trY。最后标签的数据类型定为无符号整型。测试图像文件和测试标签文件同理,只是分别产生的矩阵teX和teY的行数由60000变为10000。
像素值为0到255,所以将像素值归一化到[0,1]区间内。
选择前ntrain个训练图像例子和标签和前ntest个测试图像例子和标签。
如果onehot为真,则执行onehot函数。
(3)one_hot函数
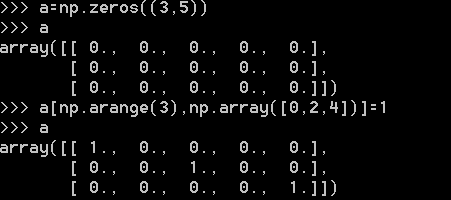
该函数的输入有x和n,x为标签,n为标签编码的范围跨度。MNIST的数据标签的值为0~9,范围跨度为10。首先设置长度为标签长度(即数据例子的个数),列数为标签的范围跨度的矩阵数组o_h,然后用np.arange(len(x))确定置1的行,用x确定置1的列。范围跨度为10的one-hot编码形式举例:
(4)图像样本显示
选择第6个图像样本和第256个图像样本作显示(Xtrain数组索引从0开始)。
4. 示例代码
import numpy as np
import os
import matplotlib.pyplot as plt

datasets_dir = 'media/datasets/'

def one_hot(x,n):
	if type(x) == list:
		x = np.array(x)
	x = x.flatten()
	o_h = np.zeros((len(x),n))
	o_h[np.arange(len(x)),x] = 1
	return o_h

def mnist(ntrain=60000,ntest=10000,onehot=True):
	data_dir = os.path.join(datasets_dir,'mnist/')
	fd = open(os.path.join(data_dir,'train-images.idx3-ubyte'))
	loaded = np.fromfile(file=fd,dtype=np.uint8)
	trX = loaded[16:].reshape((60000,28*28)).astype(float)

	fd = open(os.path.join(data_dir,'train-labels.idx1-ubyte'))
	loaded = np.fromfile(file=fd,dtype=np.uint8)
	trY = loaded[8:].reshape((60000))

	fd = open(os.path.join(data_dir,'t10k-images.idx3-ubyte'))
	loaded = np.fromfile(file=fd,dtype=np.uint8)
	teX = loaded[16:].reshape((10000,28*28)).astype(float)

	fd = open(os.path.join(data_dir,'t10k-labels.idx1-ubyte'))
	loaded = np.fromfile(file=fd,dtype=np.uint8)
	teY = loaded[8:].reshape((10000))

	trX = trX/255.
	teX = teX/255.

	trX = trX[:ntrain]
	trY = trY[:ntrain]

	teX = teX[:ntest]
	teY = teY[:ntest]

	if onehot:
		trY = one_hot(trY, 10)
		teY = one_hot(teY, 10)
	else:
		trY = np.asarray(trY)
		teY = np.asarray(teY)

	return trX,teX,trY,teY

Xtrain, Xtest, Ytrain, Ytest = mnist()
################################################

# 数字样本显示

image = Xtrain[5].reshape(28,28)
image1 = Xtrain[255].reshape(28,28)

fig = plt.figure()
ax = fig.add_subplot(121)
ax.xaxis.set_ticklabels([])
ax.yaxis.set_ticklabels([])
plt.imshow(image, cmap='gray')

ax =  fig.add_subplot(122)
ax.xaxis.set_ticklabels([])
ax.yaxis.set_ticklabels([])
plt.imshow(image1, cmap='gray')
plt.show()
5. 实验结果
6.参考链接
(1)数据库下载:http://yann.lecun.com/exdb/mnist/
(2)数据库加载:https://github.com/Newmu/Theano-Tutorials/blob/master/load.py
(3)图像显示:http://www.cnblogs.com/x1957/archive/2012/06/02/2531503.html

