Network Troubleshooting Using ESXCLI 5.1 (VMware vSphere Blog)
When it comes to network troubleshooting in an ESXi host, there are various types of information that can be useful to a vSphere administrator such as basic information like a virtual machine’s IP Addresses, MAC Addresses, Uplink ports, Port ID, etc. to the network statistics view in the [r]esxtop command-line utility. However, all of this useful information today is spread across multiple tools and this can be challenging for a vSphere administrator when needing to quickly retrieve this data while troubleshooting an issue.
With the release of vSphere 5.1, the network namespace in ESXCLI has been enhanced to include a comprehensive set network statistics at various points in the virtual network. This enables a vSphere administrator to easily get an overall status of the vSphere network as well as provide the ability to drill down further for troubleshooting.
In ESXCLI 5.1, you can now retrieve additional network statistics at a physical NIC ( vmnic ), on a per VLAN ( portgroup ) which needs to be configured and on a per VM port ( vNIC ). Here is a quick diagram to help you visualize where you can retrieve network statistics:
Note: Network statistics are available on a per host basis and this is applicable to both a Distributed Virtual Switch as well as a regular Virtual Standard Switch.
Let’s start off by taking a looking at the physical NIC of the ESXi host or vmnic as it is commonly referred to. You will need to identify the vmnic you are interested in and you can list all available vmnics on your ESXi host by running the following command:
esxcli network nic list
![]() We can see from the screenshot above that we have four vmnics (0-3) on this host and let’s say we are interesting in getting statistics for vmnic2. We can do so by using the new “ stats ” namespace by running the following command and specifying the vmnic of our choice:
We can see from the screenshot above that we have four vmnics (0-3) on this host and let’s say we are interesting in getting statistics for vmnic2. We can do so by using the new “ stats ” namespace by running the following command and specifying the vmnic of our choice:
esxcli network nic stats get -n vmnic2
 You will get some basic stats such as packet transmit/received and bytes transmit/received but in addition you will also get new stats pertaining to length, over, CRC, frame, FIFO and missed transmit/received.
Next, let’s take a look at statistics on a per portgroup or more specifically on a per VLAN basis using the new “ vlan ” namespace. By default VLAN statistics is disabled and you will need to enable this on each vmnic that you wish to pull statistics from. We will go ahead and enable VLAN stats collection on vmnic2 by running the following command (replace with the vmnic of choice):
esxcli network nic vlan stats set -e true -n vmnic2
and then run the following command to retrieve all VLAN stats for that given vmnic interface (replace with the vmnic of choice):
esxcli network nic vlan stats get -n vmnic2
 For VLAN statistics, you will see packets received and sent for each VLAN ID for that given vmnic interface.
Finally, let’s take a look at the network details and statistics for our virtual machines. There is new “ vm ” namespace that allows you to easily list all virtual machines including the number of ports (configured vNIC) as well as the networks they are connected to. You will need to run the following command:
esxcli network vm list
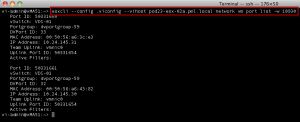
Included in the output is also the VM’s World ID which can be thought of as the process ID for that given VM. Next, we will take this World ID and run the following command to get more details about the VM’s network configuration which includes the Port ID, VSS/VDS, Portgroup, DVPort Group, MAC Address, IP Address, vmnic Uplink, Uplink ID and any active filters (replace with the World ID of choice):
esxcli network vm port list -w 10930
 As you can see, just from a single command, you can now easily retrieve all the networking details about your VM where-as before this would require the use of multiple tools to get the same info versus having a single location for quick ease of access.
Note: The IP Address information is made available by ARP packet inspection and this is disabled by default. If you wish to see the IP Address information, you will need to enable this by running the following command: esxcli system settings advanced set -o /Net/GuestIPHack -i 1
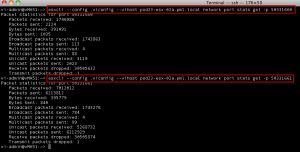
From here, we can drill down one additional level and retrieve network statistics on a per VM port (vNIC) level which is available through the new “ port ” namespace. You will need to identify the Port ID from the last step and then run the following command (replace with the Port ID of choice):
esxcli network port stats get -p 50331660
 Hopefully with these new enhancements to ESXCLI, gathering networking details and statistics for your virtual machines will be much easier to perform as well as easier to consume without having to use multiple tools. To get more details, you can refer to the ESXCLI documentation .
Note: All these statistics are available via SNMP and can be monitored remotely. For details on configuring SNMP traps for your ESXi host, please refer to this article .
Get notification of new blog postings and more by following VMware Automation on Twitter: @VMWAutomation
