广义线性模型(1)
1.1. Generalized Linear Models(广义线性模型)
- 线性模型(linear model),也称经典线性模型(classical linear model)或一般线型模型(general linear model,GLM)。
- 广义线性模型(generalized linear model,GENMOD)由Nelder & Wedderburn(1972)首先提出,是一般线性模型的直接推广,它使因变量的总体均值通过一个非线性连接函数(link function)而依赖于线性预测值,同时还允许响应概率分布为指数分布族中的任何一员。许多广泛应用的统计模型均属于广义线性模型,如logistic回归模型、Probit回归模型、Poisson回归模型、负二项回归模型等。
- 一个广义线性模型包括三个组成部分:线性成分(linear component);随机成分(random component);连接函数(link function),连接函数为一单调可微(连续且充分光滑)的函数。
线性模型的目标函数,如下所示:
![]()
(1) logistic回归(logistic regression)为概率型非线性回归模型,是研究分类观察结果与一些影响因素之间关系的一种多变量分析方法。
(2) 非线性回归(non-linear regression)是在掌握大量观察数据的基础上,利用数理统计方法建立因变量与自变量之间的回归关系函数表达式(称回归方程式)。
(3) 线性回归(linear regression)是利用数理统计中的回归分析,来确定两种或两种以上变量间相互依赖的定量关系的一种统计分析方法,运用十分广泛。分析按照自变量和因变量之间的关系类型,可分为线性回归分析和非线性回归分析。
(4) 回归分析中,当研究的因果关系只涉及因变量和一个自变量时,叫做一元回归分析;当研究的因果关系涉及因变量和两个或两个以上自变量时,叫做多元回归分析。
(5) 回归分析中,只包括一个自变量和一个因变量,且二者的关系可用一条直线近似表示,这种回归分析称为一元线性回归分析。如果回归分析中包括两个或两个以上的自变量,且因变量和自变量之间是线性关系,则称为多元线性回归分析。
(6) 回归分析中,只包括一个自变量和一个因变量,且二者的关系不可用一条直线近似表示,这种回归分析称为一元非线性回归分析。如果回归分析中包括两个或两个以上的自变量,且因变量和自变量之间是非线性关系,则称为多元非线性回归分析。
总结:
线性回归;非线性回归;一元回归;多元回归;一元线性回归;多元线性回归;一元非线性回归;多元非线性回归。
1.1.1. Ordinary Least Squares(普通最小二乘法)
普通最小二乘法目标函数,如下所示:
![]()
解析:
(1) 残差平方和(residual sum of squares):为了明确解释变量和随机误差各产生的效应是多少,统计学上把数据点与它在回归直线上相应位置的差异称为残差,把每个残差平方之后加起来 称为残差平方和,它表示随机误差的效应。
(2) 普通最小二乘法是最小二乘法的一个特例,最小二乘法是加权最小二乘法的一个特例。
(3 )GLS(广义最小二乘法)是一种常见的消除异方差的方法,它的主要思想是为解释变量加上一个权重,从而使得加上权重后的回归方程方差是相同的。因此,在GLS方法下我们可以得到估计量的无偏和一致估计,并可以对其进行OLS(普通最小二乘法)下的t检验和F检验。
总结:
最小二乘法;普通最小二乘法;加权最小二乘法;广义最小二乘法。
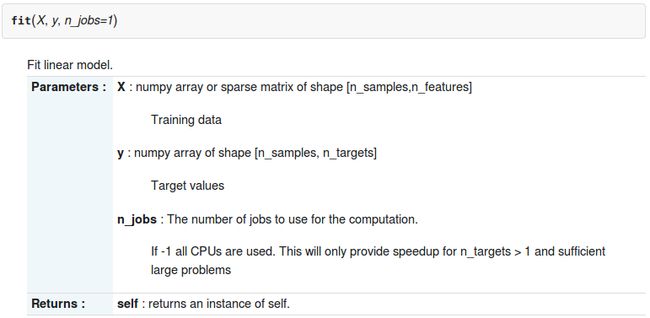
线性回归实现代码,如下所示:
In [1]: from sklearn import linear_model

In [2]: clf = linear_model.LinearRegression()

In [3]: clf.fit([[0, 0], [1, 1], [2, 2]], [0, 1, 2])
Out[3]: LinearRegression(copy_X=True, fit_intercept=True, normalize=False)

In [4]: clf.coef_
Out[4]: array([ 0.5,  0.5])

In [5]: clf.intercept_
Out[5]: 2.2204460492503131e-16
解析:
(1)sklearn.linear_model.LinearRegression类构造函数
class sklearn.linear_model.LinearRegression(fit_intercept=True, normalize=False, copy_X=True)
(2)sklearn.linear_model.LinearRegression类实例的属性和方法
Linear Regression Example
print(__doc__)

# Code source: Jaques Grobler
# License: BSD 3 clause

# pylab提供了比较强大的画图功能
import pylab as pl
# numpy是python的科学计算库
import numpy as np
from sklearn import datasets, linear_model

# Load the diabetes(糖尿病) dataset
diabetes = datasets.load_diabetes()


# Use only one feature
diabetes_X = diabetes.data[:, np.newaxis]
diabetes_X_temp = diabetes_X[:, :, 2]

# Split the data into training/testing sets
diabetes_X_train = diabetes_X_temp[:-20]
diabetes_X_test = diabetes_X_temp[-20:]

# Split the targets into training/testing sets
diabetes_y_train = diabetes.target[:-20]
diabetes_y_test = diabetes.target[-20:]

# Create linear regression object
regr = linear_model.LinearRegression()

# Train the model using the training sets
regr.fit(diabetes_X_train, diabetes_y_train)

# The coefficients
print('Coefficients: \n', regr.coef_)
# The mean square error(均方误差)
print("Residual sum of squares: %.2f"
      % np.mean((regr.predict(diabetes_X_test) - diabetes_y_test) ** 2))
# Explained variance score: 1 is perfect prediction
print('Variance score: %.2f' % regr.score(diabetes_X_test, diabetes_y_test))

# Plot outputs
pl.scatter(diabetes_X_test, diabetes_y_test,  color='black')
pl.plot(diabetes_X_test, regr.predict(diabetes_X_test), color='blue',
        linewidth=3)

pl.xticks(())
pl.yticks(())

pl.show()
输出图像,如下所示:
解析:
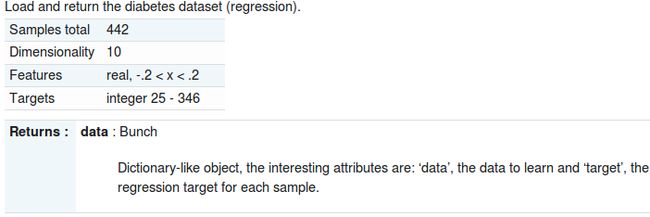
(1)sklearn.datasets.load_diabetes()方法
diabetes数据集,如下所示:
In [11]: diabetes
Out[11]:
{'data': array([[ 0.03807591,  0.05068012,  0.06169621, ..., -0.00259226,
         0.01990842, -0.01764613],
       [-0.00188202, -0.04464164, -0.05147406, ..., -0.03949338,
        -0.06832974, -0.09220405],
       [ 0.08529891,  0.05068012,  0.04445121, ..., -0.00259226,
         0.00286377, -0.02593034],
       ...,
       [ 0.04170844,  0.05068012, -0.01590626, ..., -0.01107952,
        -0.04687948,  0.01549073],
       [-0.04547248, -0.04464164,  0.03906215, ...,  0.02655962,
         0.04452837, -0.02593034],
       [-0.04547248, -0.04464164, -0.0730303 , ..., -0.03949338,
        -0.00421986,  0.00306441]]),
 'target': array([ 151.,   75.,  141.,  206.,  135.,   97.,  138.,   63.,  110.,
        310.,  101.,   69.,  179.,  185.,  118.,  171.,  166.,  144.,
         97.,  168.,   68.,   49.,   68.,  245.,  184.,  202.,  137.,
         85.,  131.,  283.,  129.,   59.,  341.,   87.,   65.,  102.,
        265.,  276.,  252.,   90.,  100.,   55.,   61.,   92.,  259.,
         53.,  190.,  142.,   75.,  142.,  155.,  225.,   59.,  104.,
        182.,  128.,   52.,   37.,  170.,  170.,   61.,  144.,   52.,
        ...,
         91.,  111.,  152.,  120.,   67.,  310.,   94.,  183.,   66.,
        173.,   72.,   49.,   64.,   48.,  178.,  104.,  132.,  220.,   57.])}
diabetes.data和diabetes.target的shape属性,如下所示:
In [16]: diabetes.data.shape
Out[16]: (442, 10)

In [17]: diabetes.target.shape
Out[17]: (442,)
(2)np.newaxis
假设y.shape是(5, 7),插入维度y[:, np.newaxis, :].shape变成了(5, 1, 7)。新增的维度里面没有元素,但运算时行为遵照新的array的适用原则。合并array时很有用,假设x是(1, 5)的array,则x[:, np.newaxis] + x[np.newaxis, :]返回的是一个(5, 5)的array。
(3)diabetes_X数据集及shape属性,如下所示:
In [29]: diabetes_X
Out[29]:
array([[[ 0.03807591,  0.05068012,  0.06169621, ..., -0.00259226,
          0.01990842, -0.01764613]],

       [[-0.00188202, -0.04464164, -0.05147406, ..., -0.03949338,
         -0.06832974, -0.09220405]],

       [[ 0.08529891,  0.05068012,  0.04445121, ..., -0.00259226,
          0.00286377, -0.02593034]],

       ...,
       [[ 0.04170844,  0.05068012, -0.01590626, ..., -0.01107952,
         -0.04687948,  0.01549073]],

       [[-0.04547248, -0.04464164,  0.03906215, ...,  0.02655962,
          0.04452837, -0.02593034]],

       [[-0.04547248, -0.04464164, -0.0730303 , ..., -0.03949338,
         -0.00421986,  0.00306441]]])

In [30]: diabetes_X.shape
Out[30]: (442, 1, 10)
(4)diabetes_X_temp数据集及shape属性,如下所示:
In [32]: diabetes_X_temp
Out[32]:
array([[ 0.06169621],
       [-0.05147406],
       [ 0.04445121],
       [-0.01159501],
       [-0.03638469],
       ...,
       [ 0.01966154],
       [-0.01590626],
       [-0.01590626],
       [ 0.03906215],
       [-0.0730303 ]])

In [33]: diabetes_X_temp.shape
Out[33]: (442, 1)
(5)diabetes_X_train和diabetes_X_test数据集及shape属性,如下所示:
In [34]: diabetes_X_train = diabetes_X_temp[:-20]

In [35]: diabetes_X_train
Out[35]:
array([[ 0.06169621],
       [-0.05147406],
       [ 0.04445121],
       ...,
       [-0.02452876],
       [-0.0547075 ],
       [-0.03638469],
       [ 0.0164281 ]])

In [36]: diabetes_X_train.shape
Out[36]: (422, 1)

In [37]: diabetes_X_test = diabetes.target[-20:]

In [38]: diabetes_X_test
Out[38]:
array([ 233.,   91.,  111.,  152.,  120.,   67.,  310.,   94.,  183.,
         66.,  173.,   72.,   49.,   64.,   48.,  178.,  104.,  132.,
        220.,   57.])

In [39]: diabetes_X_test.shape
Out[39]: (20,)
说明:diabetes_y_train = diabetes.target[:-20]和diabetes_y_test = diabetes.target[-20:]同理。
(7)predict(X)函数,如下所示:
说明:
- regr.predict(diabetes_X_test),通过diabetes_X_test,根据训练好的线性模型得到预测值。
- np.mean((regr.predict(diabetes_X_test) - diabetes_y_test) ** 2)),根据残差平方和公式,得到残差平方和的值。
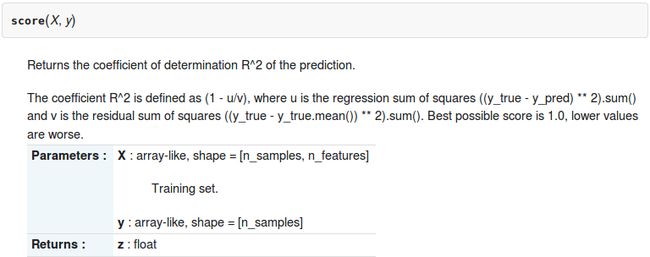
(8)score(X, y)函数,如下所示:
说明:
- the regression sum of square: 回归平方和
- the residual sum of squares: 残差平方和
注意:
regr.score(diabetes_X_test, diabetes_y_test)这个公式的物理意义不是很理解。
(9)散点图
matplotlib.pyplot.scatter(x, y, s=20, c='b', marker='o', cmap=None, norm=None, vmin=None, vmax=None, alpha=None, linewidths=None, verts=None, hold=None, **kwargs)
说明:
Make a scatter plot of x vs y, where x and y are sequence like objectsof the same lengths.
(10)直线图
matplotlib.pyplot.plot(*args, **kwargs)
说明:
Plot lines and/or markers to the Axes. args is a variable length argument, allowing for multiple x, y pairs with an optional format string.
参考文献:
[1] 广义线性模型:http://baike.baidu.com/link?url=XYiRYdk0kOXJLFZXSPCXfdQ7fWaQ9eShtKPKJvfYlxEui4k0-sdKeyAV68t6lgRObrRVE-RsIz9ljHSX-9wzTK
[2] 线性回归:http://baike.baidu.com/link?url=V16S0aIQVBs3jjInzzjfObNUYCtVK0mv6M9qdVp2-bPMiTtXLwKkTk0t_MlROqWn
[3] matplotlib:http://matplotlib.org/api/pyplot_api.html#matplotlib.pyplot.plot
[4] Python Scientific Lecture Notes: http://www.tp.umu.se/~nylen/pylect/index.html


