MPAndroidChart使用指南(MVP模式)
MPAndroidChart是开源的统计图引擎,比另外一款统计图achartengine更为丰富好用。也有其它人在用HelloChart,据说和MPAndroidChart不分伯仲。MPAndroidChart提供了多种类型的统计图表,包括线性图、柱状图、饼状图、雷达图、混合图等图表,完全满足一般的需求。
项目地址:
https://github.com/PhilJay/MPAndroidChart
主要介绍了项目的大概,具体可以下源码进行研究。、
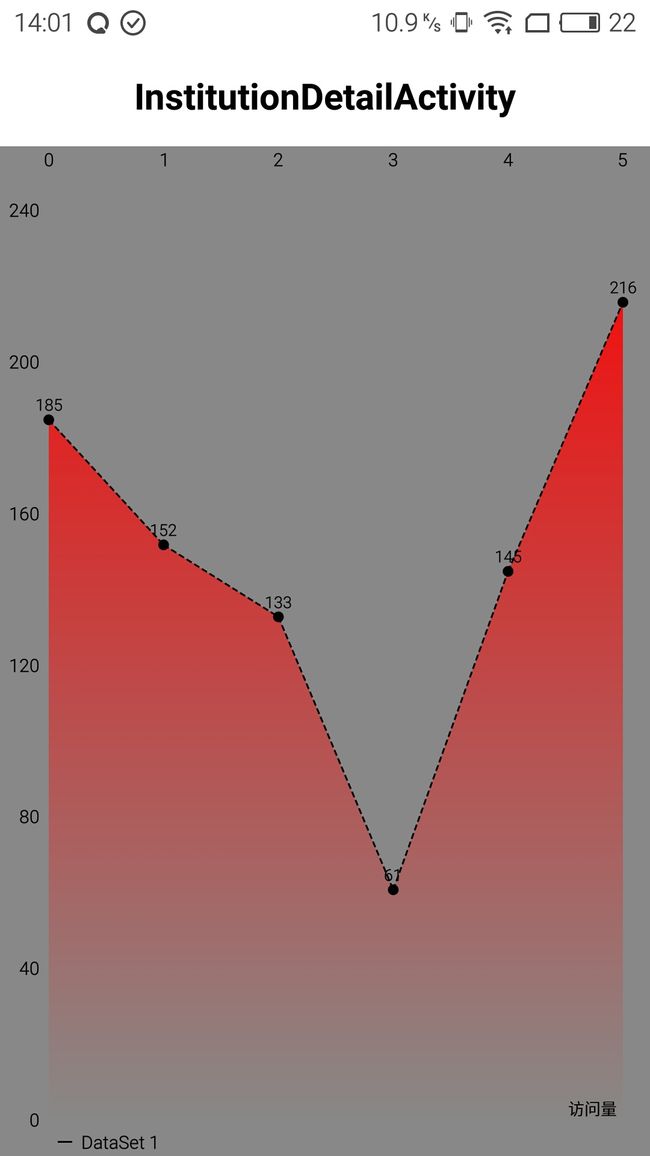
本文从Bmob后端服务器获取数据,填充到统计图中,使用的架构是MVP架构,重点的地方用有注释,便于理解。
布局文件还是很简单的,只是引入一个线性表
<?xml version="1.0" encoding="utf-8"?>
<LinearLayout xmlns:android="http://schemas.android.com/apk/res/android" android:orientation="vertical" android:layout_width="match_parent" android:layout_height="match_parent">
    <include layout="@layout/base_toolbar_layout"/>

    <com.github.mikephil.charting.charts.LineChart  android:id="@+id/institution_visit_chart" android:layout_width="match_parent" android:layout_height="match_parent">
    </com.github.mikephil.charting.charts.LineChart>

</LinearLayout>
再来看看我们的Activity
package com.graduate.lsj.lbschartforgraduate.ui.modules.activity;

import android.graphics.Color;
import android.graphics.drawable.Drawable;
import android.os.Bundle;
import android.support.v4.content.ContextCompat;
import android.util.Log;
import android.view.MotionEvent;
import android.view.View;

import com.github.mikephil.charting.animation.Easing;
import com.github.mikephil.charting.charts.LineChart;
import com.github.mikephil.charting.components.Legend;
import com.github.mikephil.charting.components.LimitLine;
import com.github.mikephil.charting.components.XAxis;
import com.github.mikephil.charting.components.YAxis;
import com.github.mikephil.charting.data.Entry;
import com.github.mikephil.charting.data.LineData;
import com.github.mikephil.charting.data.LineDataSet;
import com.github.mikephil.charting.highlight.Highlight;
import com.github.mikephil.charting.interfaces.datasets.ILineDataSet;
import com.github.mikephil.charting.listener.ChartTouchListener;
import com.github.mikephil.charting.listener.OnChartGestureListener;
import com.github.mikephil.charting.listener.OnChartValueSelectedListener;
import com.graduate.lsj.lbschartforgraduate.R;
import com.graduate.lsj.lbschartforgraduate.dao.pojo.VisitData;
import com.graduate.lsj.lbschartforgraduate.framework.base.BaseActivity;
import com.graduate.lsj.lbschartforgraduate.ui.modules.presenter.InstitutionDetailPresenter;
import com.graduate.lsj.lbschartforgraduate.ui.modules.viewimpl.InstitutionDetailImpl;
import com.graduate.lsj.lbschartforgraduate.ui.view.MyMarkerView;
import com.graduate.lsj.lbschartforgraduate.utils.SystemUtil;

import org.xutils.view.annotation.ViewInject;
import org.xutils.x;

import java.util.ArrayList;

/** * Created by lsj on 2016/4/1. */
public class InstitutionDetailActivity extends BaseActivity implements InstitutionDetailImpl, OnChartGestureListener, OnChartValueSelectedListener {

    @ViewInject(R.id.institution_visit_chart)
    LineChart mChart;
    private InstitutionDetailPresenter mPresenter;
    private VisitData mVisitData;
    private String mObjectID;

    @Override
    protected void onCreate(Bundle savedInstanceState) {
        super.onCreate(savedInstanceState);
        setContentView(R.layout.activity_institution_detail);

        x.view().inject(this);

        mObjectID=getIntent().getStringExtra("objectID");
        mPresenter = new InstitutionDetailPresenter(this, this);
        mPresenter.init();
        mPresenter.loadData(mObjectID);

    }

    @Override
    public void deploySuccess(VisitData visitData) {
        mVisitData = visitData;
        setData(mVisitData);
    }

    private void setData(VisitData visitData) {
        ArrayList<String> xVals = new ArrayList<String>();
        for (int i = 0; i < 6; i++) {
            xVals.add(i + "");
        }

        ArrayList<Entry> yVals = new ArrayList<>();

        yVals.add(new Entry(visitData.getVisit1(),0));
        yVals.add(new Entry(visitData.getVisit2(),1));
        yVals.add(new Entry(visitData.getVisit3(),2));
        yVals.add(new Entry(visitData.getVisit4(),3));
        yVals.add(new Entry(visitData.getVisit5(),4));
        yVals.add(new Entry(visitData.getVisit6(),5));

        // create a dataset and give it a type
        LineDataSet set1 = new LineDataSet(yVals, "DataSet 1");
        // set1.setFillAlpha(110);
        // set1.setFillColor(Color.RED);

        // set the line to be drawn like this "- - - - - -"
        set1.enableDashedLine(10f, 5f, 0f);
        set1.enableDashedHighlightLine(10f, 5f, 0f);
        set1.setColor(Color.BLACK);
        set1.setCircleColor(Color.BLACK);
        set1.setLineWidth(1f);
        set1.setCircleRadius(3f);
        set1.setDrawCircleHole(false);
        set1.setValueTextSize(9f);
        set1.setDrawFilled(true);

        if(SystemUtil.getSDKInt() >= 18) {
            // fill drawable only supported on api level 18 and above
            Drawable drawable = ContextCompat.getDrawable(this, R.drawable.fade_red);
            set1.setFillDrawable(drawable);
        } else {
            set1.setFillColor(Color.YELLOW);
        }


        ArrayList<ILineDataSet> dataSets = new ArrayList<ILineDataSet>();
        dataSets.add(set1); // add the datasets

        // create a data object with the datasets
        LineData data = new LineData(xVals, dataSets);

        // set data
        mChart.setData(data);

    }


    @Override
    public void deployFailed() {

    }

    @Override
    public void initView(View view) {

        mChart.setDrawGridBackground(false);

        // no description text
        mChart.setDescription("访问量");
        mChart.setNoDataTextDescription("You need to provide data for the chart.");

        // enable touch gestures
        mChart.setTouchEnabled(true);

        // enable scaling and dragging
        mChart.setDragEnabled(true);
        mChart.setScaleEnabled(true);
        // mChart.setScaleXEnabled(true);
        // mChart.setScaleYEnabled(true);

        // if disabled, scaling can be done on x- and y-axis separately
        mChart.setPinchZoom(true);

        // set an alternative background color
        mChart.setBackgroundColor(Color.GRAY);

        // create a custom MarkerView (extend MarkerView) and specify the layout
        // to use for it
        MyMarkerView mv = new MyMarkerView(this, R.layout.custom_marker_view);

        // set the marker to the chart
        mChart.setMarkerView(mv);

        // x-axis limit line
        LimitLine llXAxis = new LimitLine(10f, "Index 10");
        llXAxis.setLineWidth(4f);
        llXAxis.enableDashedLine(10f, 10f, 0f);
        llXAxis.setLabelPosition(LimitLine.LimitLabelPosition.RIGHT_BOTTOM);
        llXAxis.setTextSize(10f);

        XAxis xAxis = mChart.getXAxis();
        //xAxis.setValueFormatter(new MyCustomXAxisValueFormatter());
        //xAxis.addLimitLine(llXAxis); // add x-axis limit line

        YAxis leftAxis = mChart.getAxisLeft();
        leftAxis.removeAllLimitLines(); // reset all limit lines to avoid overlapping lines
//        leftAxis.addLimitLine(ll1);
//        leftAxis.addLimitLine(ll2);
        leftAxis.setAxisMaxValue(250f);
        leftAxis.setAxisMinValue(-0f);
        //leftAxis.setYOffset(20f);
        leftAxis.enableGridDashedLine(10f, 10f, 0f);
        leftAxis.setDrawZeroLine(false);

        // limit lines are drawn behind data (and not on top)
        leftAxis.setDrawLimitLinesBehindData(true);

        mChart.getAxisRight().setEnabled(false);

        //mChart.getViewPortHandler().setMaximumScaleY(2f);
        //mChart.getViewPortHandler().setMaximumScaleX(2f);

//        mChart.setVisibleXRange(20);
//        mChart.setVisibleYRange(20f, AxisDependency.LEFT);
//        mChart.centerViewTo(20, 50, AxisDependency.LEFT);

        mChart.animateX(2500, Easing.EasingOption.EaseInOutQuart);
//        mChart.invalidate();

        // get the legend (only possible after setting data)
        Legend l = mChart.getLegend();

        // modify the legend ...
        // l.setPosition(LegendPosition.LEFT_OF_CHART);
        l.setForm(Legend.LegendForm.LINE);

        // // dont forget to refresh the drawing
        // mChart.invalidate();

    }

    @Override
    public void initListener() {
        mChart.setOnChartGestureListener(this);
        mChart.setOnChartValueSelectedListener(this);

    }

    @Override
    public void showLoading(boolean shouldShow) {

    }

    @Override
    public void onChartGestureStart(MotionEvent me, ChartTouchListener.ChartGesture lastPerformedGesture) {
        Log.i("Gesture", "START, x: " + me.getX() + ", y: " + me.getY());
    }

    @Override
    public void onChartGestureEnd(MotionEvent me, ChartTouchListener.ChartGesture lastPerformedGesture) {
        Log.i("Gesture", "END, lastGesture: " + lastPerformedGesture);

        // un-highlight values after the gesture is finished and no single-tap
        if(lastPerformedGesture != ChartTouchListener.ChartGesture.SINGLE_TAP)
            mChart.highlightValues(null); // or highlightTouch(null) for callback to onNothingSelected(...)
    }

    @Override
    public void onChartLongPressed(MotionEvent me) {
        Log.i("LongPress", "Chart longpressed.");
    }

    @Override
    public void onChartDoubleTapped(MotionEvent me) {
        Log.i("DoubleTap", "Chart double-tapped.");
    }

    @Override
    public void onChartSingleTapped(MotionEvent me) {
        Log.i("SingleTap", "Chart single-tapped.");
    }

    @Override
    public void onChartFling(MotionEvent me1, MotionEvent me2, float velocityX, float velocityY) {
        Log.i("Fling", "Chart flinged. VeloX: " + velocityX + ", VeloY: " + velocityY);
    }

    @Override
    public void onChartScale(MotionEvent me, float scaleX, float scaleY) {
        Log.i("Scale / Zoom", "ScaleX: " + scaleX + ", ScaleY: " + scaleY);
    }

    @Override
    public void onChartTranslate(MotionEvent me, float dX, float dY) {
        Log.i("Translate / Move", "dX: " + dX + ", dY: " + dY);
    }

    @Override
    public void onValueSelected(Entry e, int dataSetIndex, Highlight h) {
        Log.i("Entry selected", e.toString());
        Log.i("LOWHIGH", "low: " + mChart.getLowestVisibleXIndex() + ", high: " + mChart.getHighestVisibleXIndex());
        Log.i("MIN MAX", "xmin: " + mChart.getXChartMin() + ", xmax: " + mChart.getXChartMax() + ", ymin: " + mChart.getYChartMin() + ", ymax: " + mChart.getYChartMax());
    }

    @Override
    public void onNothingSelected() {
        Log.i("Nothing selected", "Nothing selected.");
    }
}
Activity实现了一个MVP接口:institutionDetailImpl和两个MPAndroidChart接口OnChartGestureListener, OnChartValueSelectedListener,并能过一个presenter来实现P层控制
现在来看看我们的institutionDetailImpl和institutionPresenter
institutionDetailImpl比较简单,主要是提供了两个更新结果的接口,以以供presenter调用
package com.graduate.lsj.lbschartforgraduate.ui.modules.viewimpl;

import com.graduate.lsj.lbschartforgraduate.dao.pojo.VisitData;
import com.graduate.lsj.lbschartforgraduate.framework.base.BaseViewImpl;

/** * Created by lsj on 2016/4/1. */
public interface InstitutionDetailImpl extends BaseViewImpl {
    void deploySuccess(VisitData visitData);
    void deployFailed();

}
InstitutionDetailPresenter只提供一个方法,能过向Bmob后端服务器发起请求,得到数据返回,实现InstitutionDetailImpl的接口。
package com.graduate.lsj.lbschartforgraduate.ui.modules.presenter;

import android.app.Activity;

import com.graduate.lsj.lbschartforgraduate.dao.pojo.VisitData;
import com.graduate.lsj.lbschartforgraduate.framework.base.BasePresenter;
import com.graduate.lsj.lbschartforgraduate.ui.modules.viewimpl.InstitutionDetailImpl;
import com.graduate.lsj.lbschartforgraduate.utils.ToastUtil;

import java.util.List;

import cn.bmob.v3.BmobQuery;
import cn.bmob.v3.listener.FindListener;

/** * Created by lsj on 2016/4/1. */
public class InstitutionDetailPresenter extends BasePresenter<InstitutionDetailImpl> {
    /** * Constructor * * @param activity context * @param viewImpl view interface */
    public InstitutionDetailPresenter(Activity activity, InstitutionDetailImpl viewImpl) {
        super(activity, viewImpl);
    }

    public void loadData(String objectID) {
        BmobQuery<VisitData> query = new BmobQuery<>();
        query.addWhereEqualTo("institution", objectID);
        query.findObjects(activity, new FindListener<VisitData>() {
            @Override
            public void onSuccess(List<VisitData> list) {
                if (list.size() >= 1){
                    viewImpl.deploySuccess(list.get(0));
                    ToastUtil.get().showShortToast(activity,"查询成功");
                }else {
                    viewImpl.deployFailed();
                }
            }

            @Override
            public void onError(int i, String s) {
                viewImpl.deployFailed();
                ToastUtil.get().showShortToast(activity, "查询失败");
            }
        });

    }
}
主要内容就是这些,关于继承的基类我就不贴上来了。有空我会把源码放上来。
