ML——逻辑回归算法
使用python实现逻辑回归算法
数据来源:鸢尾花数据集
导入数据集,选取用来做试验的数据
df = pd.read_csv('data/iris.csv')

# 选取 setosa 和 versicolor 两种花
# 两种各选择50个, 把类别改为 0 和 1, 方便画图
y = df.iloc[0:100, 4].values
y = np.where(y == 'setosa', 0, 1)

# 提取 sepal length 和 petal length 两种特征的数据
X = df.iloc[0:100, [0, 2]].values

# 特征标准化
X_std = np.copy(X)
X_std[:,0] = (X[:,0] - X[:,0].mean()) / X[:,0].std()
X_std[:,1] = (X[:,1] - X[:,1].mean()) / X[:,1].std()
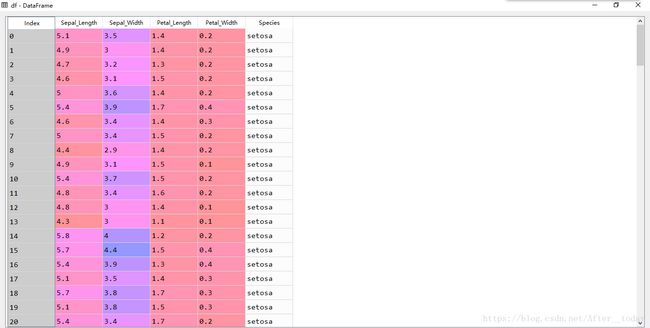
从左到右依次为花萼长度、花萼宽度、花瓣长度、花瓣宽度和花的种类
实现逻辑回归算法中梯度下降的类
这里参数很多,结合https://blog.csdn.net/After__today/article/details/81604249中的逻辑回归的假设函数、代价函数和更新规则来理解。
y_val计算![]() 的值,errors计算的是
的值,errors计算的是![]() 与
与![]() (真实值)的差。
(真实值)的差。
w_ += eta * neg_grad实现w_(即![]() )的更新,这里为什么是 + 呢,因为 errors = (y - y_val)。
)的更新,这里为什么是 + 呢,因为 errors = (y - y_val)。
cost记录每一轮迭代中的代价值,_logit_cost函数实现![]() 的计算。
的计算。
predict_proba函数预测样本X为1的概率的估计值。
predict预测X的标签为 0 或 1。
class LogisticRegression(object):
    """
    参数
    ----------
    eta : float
        学习速率 (between 0.0 and 1.0)
    n_iter : int
        迭代次数
    -----------
    属性
    ----------
    w_ : 1d-array
        拟合后的权重, 即θ
    cost_ : list
        每次迭代的代价, 即Jθ
    """
    def __init__(self, eta, n_iter):
        self.eta = eta
        self.n_iter = n_iter

    # 训练函数
    def fit(self, X, y):

        """
        参数
        ----------
        X : {array-like}, shape = [n_samples, n_features]
            训练集特征向量, n_samples为样本数量, n_features为特征向量的数量
        y : array-like, shape = [n_samples]
            训练集的目标值
        ----------
        Returns
        ----------
        self : object
        """

        self.w_ = np.zeros(X.shape[1])
        self.cost_ = []
        for i in range(self.n_iter):
            y_val = self.activation(X)
            errors = (y - y_val)
            neg_grad = X.T.dot(errors)
            self.w_ += self.eta * neg_grad
            self.cost_.append(self._logit_cost(y, self.activation(X)))
        return self

    def _logit_cost(self, y, y_val):
        """计算代价函数值"""
        logit = -y.dot(np.log(y_val)) - ((1 - y).dot(np.log(1 - y_val)))
        return logit

    def _sigmoid(self, z):
        """计算逻辑函数值"""
        return 1.0 / (1.0 + np.exp(-z))

    def net_input(self, X):
        """计算逻辑函数输入"""
        return np.dot(X, self.w_)

    def activation(self, X):
        """激活逻辑神经元"""
        z = self.net_input(X)
        return self._sigmoid(z)

    def predict_proba(self, X):
        """样本X为1的概率的估计值"""
        return self.activation(X)

    def predict(self, X):
        """预测X的标签, 将大于0的值归为1, 小于0的归为0"""
        return np.where(self.net_input(X) >= 0.0, 1, 0)
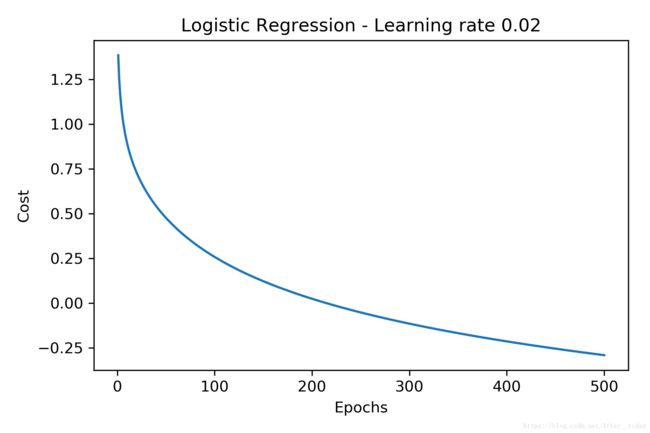
绘制代价函数
# 学习速率0.02, 迭代次数500次
lr = LogisticRegression(n_iter=500, eta=0.02).fit(X_std, y)
plt.plot(range(1, len(lr.cost_) + 1), np.log10(lr.cost_))
plt.xlabel('Epochs')
plt.ylabel('Cost')
plt.title('Logistic Regression - Learning rate 0.02')
plt.tight_layout()
利用ListedColormap编写绘制边界函数
def plot_decision_regions(X, y, classifier, resolution=0.02):
    # 利用ListedColormap设置 marker generator 和 color map
    markers = ('s', 'x', 'o', '^', 'v')
    colors = ('red', 'blue', 'lightgreen', 'gray', 'cyan')
    cmap = ListedColormap(colors[:len(np.unique(y))])

    # 确定横纵轴边界
    x1_min, x1_max = X[:, 0].min() - 1, X[:, 0].max() + 1  # 最小-1, 最大+1
    x2_min, x2_max = X[:, 1].min() - 1, X[:, 1].max() + 1

    # 建立一对grid arrays(网格阵列)
    # 铺平grid arrays,然后进行预测
    xx1, xx2 = np.meshgrid(np.arange(x1_min, x1_max, resolution),
                         np.arange(x2_min, x2_max, resolution))
    Z = classifier.predict(np.array([xx1.ravel(), xx2.ravel()]).T) # .revel()降维函数
    Z = Z.reshape(xx1.shape)

    # 将不同的决策边界对应不同的颜色
    plt.contourf(xx1, xx2, Z, alpha=0.4, cmap=cmap)
    # 设置坐标轴的范围
    plt.xlim(xx1.min(), xx1.max())
    plt.ylim(xx2.min(), xx2.max())

    # 绘制样本点
    for idx, cl in enumerate(np.unique(y)):
        plt.scatter(x=X[y == cl, 0], y=X[y == cl, 1],
                    alpha=0.8, c=cmap(idx),
                    marker=markers[idx], label=cl)
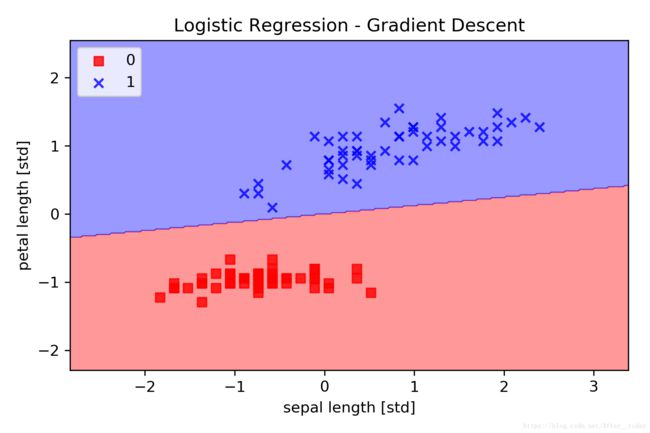
绘制分类边界
plot_decision_regions(X_std, y, classifier=lr)
plt.title('Logistic Regression - Gradient Descent')
plt.xlabel('sepal length [std]')
plt.ylabel('petal length [std]')
plt.legend(loc='upper left')
plt.tight_layout()
利用scikit-learn进行分类任务
加载数据,特征标准化处理
iris = datasets.load_iris()
X = iris.data[:, [2, 3]]   # 这里我们选择对三种花分类
y = iris.target

X_train, X_test, y_train, y_test = train_test_split(
         X, y, test_size=0.3, random_state=0)

sc = StandardScaler()
sc.fit(X_train)
X_train_std = sc.transform(X_train)
X_test_std = sc.transform(X_test)

X_combined_std = np.vstack((X_train_std, X_test_std))
y_combined = np.hstack((y_train, y_test))
重新定义个画分类边界的函数
def plot_decision_regions(X, y, classifier, test_idx=None, resolution=0.02):

    markers = ('s', 'x', 'o', '^', 'v')
    colors = ('red', 'blue', 'lightgreen', 'gray', 'cyan')
    cmap = ListedColormap(colors[:len(np.unique(y))])

    x1_min, x1_max = X[:, 0].min() - 1, X[:, 0].max() + 1
    x2_min, x2_max = X[:, 1].min() - 1, X[:, 1].max() + 1
    xx1, xx2 = np.meshgrid(np.arange(x1_min, x1_max, resolution),
                         np.arange(x2_min, x2_max, resolution))
    Z = classifier.predict(np.array([xx1.ravel(), xx2.ravel()]).T)
    Z = Z.reshape(xx1.shape)
    plt.contourf(xx1, xx2, Z, alpha=0.4, cmap=cmap)
    plt.xlim(xx1.min(), xx1.max())
    plt.ylim(xx2.min(), xx2.max())

    for idx, cl in enumerate(np.unique(y)):
        plt.scatter(x=X[y == cl, 0], y=X[y == cl, 1],
                    alpha=0.8, c=cmap(idx),
                    marker=markers[idx], label=cl)

    if test_idx:
        X_test = X[test_idx, :]
        plt.scatter(X_test[:, 0], X_test[:, 1], c='b',
                alpha=0.1, linewidth=1, marker='o',
                s=55, label='test sets')
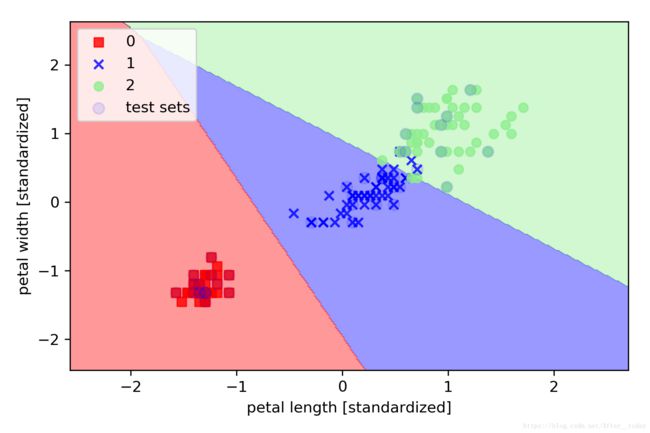
利用logistic regression建模分类
lr = LogisticRegression(C=1000.0, random_state=0)   # C是正则化系数λ的倒数
lr.fit(X_train_std, y_train)

plot_decision_regions(X_combined_std, y_combined,
                      classifier=lr, test_idx=range(105,150))
plt.xlabel('petal length [std]')
plt.ylabel('petal width [std]')
plt.legend(loc='upper left')
plt.tight_layout()
拿个例子看看预测效果:
predict_proba输出的是预测x为某一类的概率
解决拟合过程中的过拟合问题
过拟合问题在这篇笔记中有介绍https://blog.csdn.net/After__today/article/details/81805645。
这里我们手动实现利用正则化项解决过拟合问题。
代码只是在LogisticRegression()中加入了正则化项。
class LogitGD(object):
    def __init__(self, eta=0.01, lamb = 0.01, n_iter=50):
        self.eta = eta
        self.n_iter = n_iter
        self.lamb = lamb   # lamb为正则化项的系数λ

    def fit(self, X, y):

        self.w_ = np.zeros(X.shape[1])
        self.cost_ = []

        for i in range(self.n_iter):
            output = self.net_input(X)
            errors = (y - output)
            self.w_ += self.eta * X.T.dot(errors) - self.lamb* self.w_
            cost = (errors**2).sum() / 2.0 + self.lamb* np.sum(self.w_**2)
            self.cost_.append(cost)
        return self

    def net_input(self, X):
        return np.dot(X, self.w_)

    def sigmoid(z):
        return 1.0 / (1.0 + np.exp(-z))

    def activation(self, X):
        return self.sigmoid(self.net_input(X))

    def predict(self, X):
        return np.where(self.activation(X) >= 0.5, 1, -1)
完整代码见:https://github.com/After-today/Classification-problem。


