吴恩达机器学习总结:第三课 逻辑回归(大纲摘要及课后作业)
为了更好的学习,充分复习自己学习的知识,总结课内重要知识点,每次完成作业后
都会更博。
英文非官方笔记
总结
1.分类
(1)y的值是离散值,比如说0(负分类),1(正分类)
(2)从二元分类开始
(3)如何开始一个分类算法
a.利用线性回归,选个一个阈值
2.假设表示
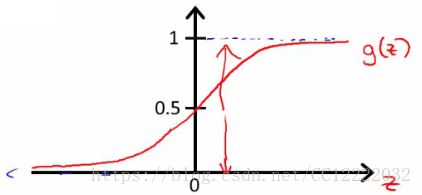
(1)逻辑函数(sigmoid函数)
a.hθ(x) = (θT x)
b.hθ(x) = g((θT x))
c.g(z) = 1/(1 + e-z)
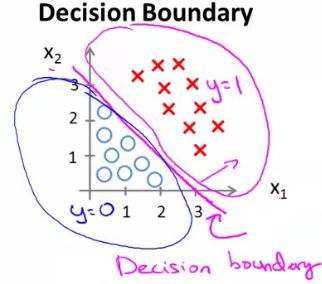
3.决策边界
(1)更好理解假设函数的外观
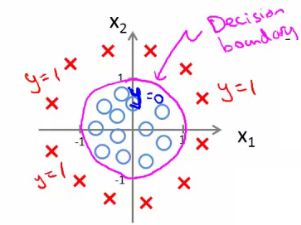
4.非线性决策边界
(1)通过拟合复杂的参数,建立更复杂的决策边界
(2)通过跟高次的多项式,可得到
5.逻辑回归的代价函数及梯度下降
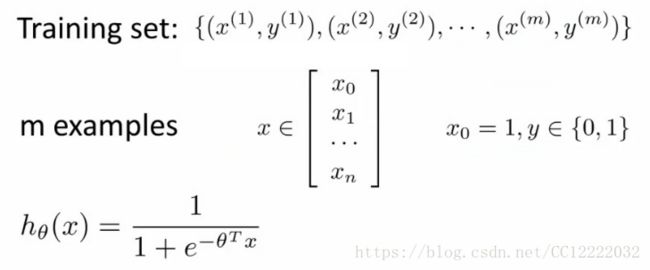
(1)需要的参数定义
(2)代价函数(通过极大似然估计可得)
(3)梯度下降(代入计算后发现与线性回归的形式一样)
(6)多元分类(转换为多个二元分类问题)
作业
(1)可视化
data = load('ex2data1.txt');
X = data(:, [1, 2]); y = data(:, 3);
plotData(X, y);
hold on;
xlabel('Exam 1 score')
ylabel('Exam 2 score')
legend('Admitted', 'Not admitted')
hold off;

%plotData函数
pos = find(y==1); neg = find(y == 0);
plot(X(pos, 1), X(pos, 2), 'k+','LineWidth', 2, ...
'MarkerSize', 7);
plot(X(neg, 1), X(neg, 2), 'ko', 'MarkerFaceColor', 'y', ...
'MarkerSize', 7);
(2)计算代价函数和梯度
[m, n] = size(X);
X = [ones(m, 1) X];
%计算theta初始为0时
initial_theta = zeros(n + 1, 1);
[cost, grad] = costFunction(initial_theta, X, y);
% 计算theta初始不为0时
test_theta = [-24; 0.2; 0.2];
[cost, grad] = costFunction(test_theta, X, y);

%代价函数和梯度实现
m = length(y); % number of training examples
J = 0;
grad = zeros(size(theta));
J = -1 * ( y' * log( sigmoid(X*theta) ) + (1 - y )' * log( (1 - sigmoid(X*theta)) ) ) / m ;
grad = ( X' * (sigmoid(X*theta) - y ) )/ m ;
(3)用先进函数来优化
options = optimset('GradObj', 'on', 'MaxIter', 400);
[theta, cost] = ...
	fminunc(@(t)(costFunction(t, X, y)), initial_theta, options);

%画决策边界
plotDecisionBoundary(theta, X, y);

%函数plotDate
plotData(X(:,2:3), y);
hold on
if size(X, 2) <= 3
    % Only need 2 points to define a line, so choose two endpoints
    plot_x = [min(X(:,2))-2,  max(X(:,2))+2];
    % Calculate the decision boundary line
    plot_y = (-1./theta(3)).*(theta(2).*plot_x + theta(1));
    % Plot, and adjust axes for better viewing
    plot(plot_x, plot_y)
        % Legend, specific for the exercise
    legend('Admitted', 'Not admitted', 'Decision Boundary')
    axis([30, 100, 30, 100])
else
    % Here is the grid range
    u = linspace(-1, 1.5, 50);
    v = linspace(-1, 1.5, 50);
    z = zeros(length(u), length(v));
    % Evaluate z = theta*x over the grid
    for i = 1:length(u)
        for j = 1:length(v)
            z(i,j) = mapFeature(u(i), v(j))*theta;
        end
    end
    z = z'; % important to transpose z before calling contour
    % Plot z = 0
    % Notice you need to specify the range [0, 0]
    contour(u, v, z, [0, 0], 'LineWidth', 2)
end
hold off
end


