【StudyQuant| Python量化投资课堂系列1】Catalyst 快速搭建 数字货币Python量化投资回测及实盘交易平台 -
Catalyst 快速搭建 数字货币Python量化投资回测及实盘交易平台
- 环境安装
- Windows要求
- Installing with pip
- 交易所数据导入
- 导入数据
- 运行策略
- 回测结果
- 其他
- 更多量化学习资源
- 关注StudyQuant
- 环境安装
- Windows要求
- Installing with pip
- 交易所数据导入
- 导入数据
- 运行策略
- 回测结果
- 其他
- 更多量化学习资源
- 关注StudyQuant
之前就听说过Catalyst这个项目,Github,1.2k star, 今天来写个搭建教程,希望能帮到大家。
Enigma- Catalyst
量化交易龙头
Enigma是数字货币量化交易的龙头,但Enigma是一个保护数据隐私的分布式计算平台,而在其之上建立的第一个应用Catalyst才是龙头级的量化投资平台,它是用Python编写的加密资产的算法交易市场。我们可以把Enigma理解为就是Catalyst底层的一个计算协议,通过Enigma来获取数据源和对数据的加密计算,而Catalyst是一个应用平台,开放给量化投资者进行数据预测和测试。因为面向投资者,Catalyst提供了丰富的API接口和交易策略的SDK供开发者使用,开发者们可以快速简单的使用这些接口来对交易策略进行开发,并通过Enigma提供的计算来验证其可行性。
其代币一个作用是是可以作为节点的保证金**,由于Enigma是公链,其**提出的类POS共识机制引入了惩罚机制,保证节点提供有效的数据。**此外,其代币可以作为计算费用,储存、检索、计算数据都需要一定的消耗(类似Gas)。
Enigma代币去年10月上交易所,随后持续了大概两个月的破发横盘,投资者怨声载道,而在今年一月开始有了爆发性的增长,高点接近20倍的涨幅,随后跟随大盘一路持续下跌,后续的发展还要看其具体的应用效果了。
Catalyst是一个用Python编写的加密资产的算法交易库。它允许交易策略易于表达,并根据历史数据(每日和分钟的分辨率)进行反向测试,提供有关特定策略性能的分析和见解。 Catalyst还支持加密资产的实时交易,从四个交易所(Binance,Bitfinex,Bittrex和Poloniex)开始,随着时间的推移会增加更多。 Catalyst使用户能够共享和策划数据,并构建有利可图的数据驱动型投资策略。请访问catalystcrypto.io以了解有关Catalyst的更多信息。
Catalyst建立在完善的Zipline项目之上。我们尽最大努力减少对通用API的结构更改,以最大限度地兼容现有的交易算法,开发人员知识和教程。
概观
易于使用:Catalyst试图摆脱你的方式,以便你可以专注于算法开发。查看提供的交易策略示例。
通过交易量支持几个顶级加密交易:Bitfinex,Bittrex,Poloniex和Binance。
安全:您和您只有权访问您帐户的每个交换API密钥。
通过交换输入所有加密资产的历史定价数据,具有每日和分钟的分辨率。请参阅Catalyst市场覆盖率概述。
回测和实时交易功能,两种模式之间的无缝过渡。
性能统计数据的输出基于Pandas DataFrames,可以很好地集成到现有的PyData生态系统中。
像matplotlib,scipy,statsmodels和sklearn这样的统计和机器学习库支持最先进的交易系统的开发,分析和可视化。
增加比特币价格(btc_usdt)作为比较交易算法性能的基准。
环境安装
Windows要求
在Windows中,您首先需要安装Microsoft Visual C ++编译器,这取决于您计划使用的Python版本:
Python 3.5,3.6:Visual C ++ 2015 Build Tools,安装Visual C ++版本14.0。 这是推荐的版本
Python 2.7:用于Python 2.7的Microsoft Visual C ++编译器,安装Visual C ++版本9.0
该软件包包含编译器和为Python软件包生成二进制轮所需的系统头集。 如果它尚未在您的系统中,请下载并安装它,然后再继续下一步。 如果您需要其他帮助,或者正在寻找其他版本的Visual C ++ for Windows(仅限高级用户),请单击此链接。
Installing with pip
$ pip install enigma-catalyst matplotlib
交易所数据导入
导入数据
在您可以回溯测试算法之前,首先需要加载Catalyst通过称为摄取的过程运行模拟所需的历史定价数据。当您提取数据时,Catalyst会从Enigma服务器(最终将迁移到Enigma Data Marketplace)以压缩形式下载该数据,并将其存储在本地以使其在运行时可用。
要获取数据,您需要运行如下命令:
catalyst ingest-exchange -x bitfinex -i btc_usd
这指示Catalyst从Bitfinex交易所下载btc_usd货币对的定价数据(这来自我们想要交易的简单算法btc_usd),我们选择使用Bitfinex交易所的历史定价数据来测试我们的算法。默认情况下,Catalyst假定您需要具有每日频率的数据(每天一个烛台)。如果您想要小频率(每分钟一个蜡烛条),您需要指定如下:
catalyst ingest-exchange -x bitfinex -i btc_usd -f minute
[====================================]摄取bitfinex的每日价格数据:100%
我们认为,对数据的管理方式有一个高层次的理解非常重要,因此需要进行以下概述:
定价数据被拆分并打包成捆绑:按时间序列组织的数据块每天在Enigma的服务器上保持最新。 Catalyst下载请求的包并重建硬盘中的完整数据集。
定价数据以每日和分钟的分辨率提供。这些是不同的捆绑数据集,并单独管理。
捆绑包是特定于交易所的,因为定价数据特定于每个交易所发生的交易。因此,您必须在摄取数据时指定要从中获取定价数据的交换。
Catalyst会跟踪所有下载的软件包,因此只需下载一次,并根据需要进行增量更新。
在实时交易模式下运行时,Catalyst将首先在本地存储的捆绑包中查找历史定价数据。如果缺少任何内容,Catalyst将在交换机上查找最新数据,并将其与本地捆绑包合并,以优化其需要对交换机发出的请求数。
运行策略
import matplotlib.pyplot as plt
import numpy as np
import pandas as pd
from logbook import Logger

from catalyst import run_algorithm
from catalyst.api import (record, symbol, order_target_percent,)
from catalyst.exchange.utils.stats_utils import extract_transactions

NAMESPACE = 'dual_moving_average'
log = Logger(NAMESPACE)


def initialize(context):
    context.i = 0
    context.asset = symbol('ltc_usd')
    context.base_price = None


def handle_data(context, data):
    # define the windows for the moving averages
    short_window = 50
    long_window = 200

    # Skip as many bars as long_window to properly compute the average
    context.i += 1
    if context.i < long_window:
        return

    # Compute moving averages calling data.history() for each
    # moving average with the appropriate parameters. We choose to use
    # minute bars for this simulation -> freq="1m"
    # Returns a pandas dataframe.
    short_data = data.history(context.asset,
                              'price',
                              bar_count=short_window,
                              frequency="1T",
                              )
    short_mavg = short_data.mean()
    long_data = data.history(context.asset,
                             'price',
                             bar_count=long_window,
                             frequency="1T",
                             )
    long_mavg = long_data.mean()

    # Let's keep the price of our asset in a more handy variable
    price = data.current(context.asset, 'price')

    # If base_price is not set, we use the current value. This is the
    # price at the first bar which we reference to calculate price_change.
    if context.base_price is None:
        context.base_price = price
    price_change = (price - context.base_price) / context.base_price

    # Save values for later inspection
    record(price=price,
           cash=context.portfolio.cash,
           price_change=price_change,
           short_mavg=short_mavg,
           long_mavg=long_mavg)

    # Since we are using limit orders, some orders may not execute immediately
    # we wait until all orders are executed before considering more trades.
    orders = context.blotter.open_orders
    if len(orders) > 0:
        return

    # Exit if we cannot trade
    if not data.can_trade(context.asset):
        return

    # We check what's our position on our portfolio and trade accordingly
    pos_amount = context.portfolio.positions[context.asset].amount

    # Trading logic
    if short_mavg > long_mavg and pos_amount == 0:
        # we buy 100% of our portfolio for this asset
        order_target_percent(context.asset, 1)
    elif short_mavg < long_mavg and pos_amount > 0:
        # we sell all our positions for this asset
        order_target_percent(context.asset, 0)


def analyze(context, perf):
    # Get the quote_currency that was passed as a parameter to the simulation
    exchange = list(context.exchanges.values())[0]
    quote_currency = exchange.quote_currency.upper()

    # First chart: Plot portfolio value using quote_currency
    ax1 = plt.subplot(411)
    perf.loc[:, ['portfolio_value']].plot(ax=ax1)
    ax1.legend_.remove()
    ax1.set_ylabel('Portfolio Value\n({})'.format(quote_currency))
    start, end = ax1.get_ylim()
    ax1.yaxis.set_ticks(np.arange(start, end, (end - start) / 5))

    # Second chart: Plot asset price, moving averages and buys/sells
    ax2 = plt.subplot(412, sharex=ax1)
    perf.loc[:, ['price', 'short_mavg', 'long_mavg']].plot(
        ax=ax2,
        label='Price')
    ax2.legend_.remove()
    ax2.set_ylabel('{asset}\n({quote})'.format(
        asset=context.asset.symbol,
        quote=quote_currency
    ))
    start, end = ax2.get_ylim()
    ax2.yaxis.set_ticks(np.arange(start, end, (end - start) / 5))

    transaction_df = extract_transactions(perf)
    if not transaction_df.empty:
        buy_df = transaction_df[transaction_df['amount'] > 0]
        sell_df = transaction_df[transaction_df['amount'] < 0]
        ax2.scatter(
            buy_df.index.to_pydatetime(),
            perf.loc[buy_df.index, 'price'],
            marker='^',
            s=100,
            c='green',
            label=''
        )
        ax2.scatter(
            sell_df.index.to_pydatetime(),
            perf.loc[sell_df.index, 'price'],
            marker='v',
            s=100,
            c='red',
            label=''
        )

    # Third chart: Compare percentage change between our portfolio
    # and the price of the asset
    ax3 = plt.subplot(413, sharex=ax1)
    perf.loc[:, ['algorithm_period_return', 'price_change']].plot(ax=ax3)
    ax3.legend_.remove()
    ax3.set_ylabel('Percent Change')
    start, end = ax3.get_ylim()
    ax3.yaxis.set_ticks(np.arange(start, end, (end - start) / 5))

    # Fourth chart: Plot our cash
    ax4 = plt.subplot(414, sharex=ax1)
    perf.cash.plot(ax=ax4)
    ax4.set_ylabel('Cash\n({})'.format(quote_currency))
    start, end = ax4.get_ylim()
    ax4.yaxis.set_ticks(np.arange(0, end, end / 5))

    plt.show()


if __name__ == '__main__':

    run_algorithm(
            capital_base=1000,
            data_frequency='minute',
            initialize=initialize,
            handle_data=handle_data,
            analyze=analyze,
            exchange_name='bitfinex',
            algo_namespace=NAMESPACE,
            quote_currency='usd',
            start=pd.to_datetime('2018-02-07', utc=True),
            end=pd.to_datetime('2018-05-09', utc=True),
        )
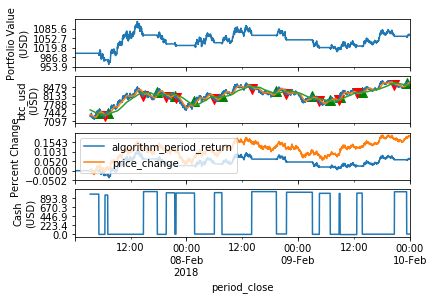
回测结果
其他
如果还有什么不懂的,欢迎添加 微信 82789754 咨询
另外课程有详细的教CATALYST搭建和策略分享
–量化投资与数字货币实战
更多量化学习资源

扫上方二维码,关注公众账号 量化投资学院 ,获取下列免费资源
- 回复**“热点研报”**,获取近年热点券商金融工程研究报告
- 回复**“Python3”**,获取Python免费学习教程
- 更多福利请点击此链接
关注StudyQuant
-
课程
–量化投资与数据分析实战
–量化投资与数字货币实战
–免费Python及量化投资公开课 -
知乎
-
简书
-
公众号之前就听说过Catalyst这个项目,Github,1.2k star, 今天来写个搭建教程,希望能帮到大家。
Enigma- Catalyst
量化交易龙头
Enigma是数字货币量化交易的龙头,但Enigma是一个保护数据隐私的分布式计算平台,而在其之上建立的第一个应用Catalyst才是龙头级的量化投资平台,它是用Python编写的加密资产的算法交易市场。我们可以把Enigma理解为就是Catalyst底层的一个计算协议,通过Enigma来获取数据源和对数据的加密计算,而Catalyst是一个应用平台,开放给量化投资者进行数据预测和测试。因为面向投资者,Catalyst提供了丰富的API接口和交易策略的SDK供开发者使用,开发者们可以快速简单的使用这些接口来对交易策略进行开发,并通过Enigma提供的计算来验证其可行性。
其代币一个作用是是可以作为节点的保证金**,由于Enigma是公链,其**提出的类POS共识机制引入了惩罚机制,保证节点提供有效的数据。**此外,其代币可以作为计算费用,储存、检索、计算数据都需要一定的消耗(类似Gas)。
Enigma代币去年10月上交易所,随后持续了大概两个月的破发横盘,投资者怨声载道,而在今年一月开始有了爆发性的增长,高点接近20倍的涨幅,随后跟随大盘一路持续下跌,后续的发展还要看其具体的应用效果了。
Catalyst是一个用Python编写的加密资产的算法交易库。它允许交易策略易于表达,并根据历史数据(每日和分钟的分辨率)进行反向测试,提供有关特定策略性能的分析和见解。 Catalyst还支持加密资产的实时交易,从四个交易所(Binance,Bitfinex,Bittrex和Poloniex)开始,随着时间的推移会增加更多。 Catalyst使用户能够共享和策划数据,并构建有利可图的数据驱动型投资策略。请访问catalystcrypto.io以了解有关Catalyst的更多信息。
Catalyst建立在完善的Zipline项目之上。我们尽最大努力减少对通用API的结构更改,以最大限度地兼容现有的交易算法,开发人员知识和教程。
概观
易于使用:Catalyst试图摆脱你的方式,以便你可以专注于算法开发。查看提供的交易策略示例。
通过交易量支持几个顶级加密交易:Bitfinex,Bittrex,Poloniex和Binance。
安全:您和您只有权访问您帐户的每个交换API密钥。
通过交换输入所有加密资产的历史定价数据,具有每日和分钟的分辨率。请参阅Catalyst市场覆盖率概述。
回测和实时交易功能,两种模式之间的无缝过渡。
性能统计数据的输出基于Pandas DataFrames,可以很好地集成到现有的PyData生态系统中。
像matplotlib,scipy,statsmodels和sklearn这样的统计和机器学习库支持最先进的交易系统的开发,分析和可视化。
增加比特币价格(btc_usdt)作为比较交易算法性能的基准。
环境安装
Windows要求
在Windows中,您首先需要安装Microsoft Visual C ++编译器,这取决于您计划使用的Python版本:
Python 3.5,3.6:Visual C ++ 2015 Build Tools,安装Visual C ++版本14.0。 这是推荐的版本
Python 2.7:用于Python 2.7的Microsoft Visual C ++编译器,安装Visual C ++版本9.0
该软件包包含编译器和为Python软件包生成二进制轮所需的系统头集。 如果它尚未在您的系统中,请下载并安装它,然后再继续下一步。 如果您需要其他帮助,或者正在寻找其他版本的Visual C ++ for Windows(仅限高级用户),请单击此链接。
Installing with pip
$ pip install enigma-catalyst matplotlib
交易所数据导入
导入数据
在您可以回溯测试算法之前,首先需要加载Catalyst通过称为摄取的过程运行模拟所需的历史定价数据。当您提取数据时,Catalyst会从Enigma服务器(最终将迁移到Enigma Data Marketplace)以压缩形式下载该数据,并将其存储在本地以使其在运行时可用。
要获取数据,您需要运行如下命令:
catalyst ingest-exchange -x bitfinex -i btc_usd
这指示Catalyst从Bitfinex交易所下载btc_usd货币对的定价数据(这来自我们想要交易的简单算法btc_usd),我们选择使用Bitfinex交易所的历史定价数据来测试我们的算法。默认情况下,Catalyst假定您需要具有每日频率的数据(每天一个烛台)。如果您想要小频率(每分钟一个蜡烛条),您需要指定如下:
catalyst ingest-exchange -x bitfinex -i btc_usd -f minute
[====================================]摄取bitfinex的每日价格数据:100%
我们认为,对数据的管理方式有一个高层次的理解非常重要,因此需要进行以下概述:
定价数据被拆分并打包成捆绑:按时间序列组织的数据块每天在Enigma的服务器上保持最新。 Catalyst下载请求的包并重建硬盘中的完整数据集。
定价数据以每日和分钟的分辨率提供。这些是不同的捆绑数据集,并单独管理。
捆绑包是特定于交易所的,因为定价数据特定于每个交易所发生的交易。因此,您必须在摄取数据时指定要从中获取定价数据的交换。
Catalyst会跟踪所有下载的软件包,因此只需下载一次,并根据需要进行增量更新。
在实时交易模式下运行时,Catalyst将首先在本地存储的捆绑包中查找历史定价数据。如果缺少任何内容,Catalyst将在交换机上查找最新数据,并将其与本地捆绑包合并,以优化其需要对交换机发出的请求数。
运行策略
import matplotlib.pyplot as plt
import numpy as np
import pandas as pd
from logbook import Logger

from catalyst import run_algorithm
from catalyst.api import (record, symbol, order_target_percent,)
from catalyst.exchange.utils.stats_utils import extract_transactions

NAMESPACE = 'dual_moving_average'
log = Logger(NAMESPACE)


def initialize(context):
    context.i = 0
    context.asset = symbol('ltc_usd')
    context.base_price = None


def handle_data(context, data):
    # define the windows for the moving averages
    short_window = 50
    long_window = 200

    # Skip as many bars as long_window to properly compute the average
    context.i += 1
    if context.i < long_window:
        return

    # Compute moving averages calling data.history() for each
    # moving average with the appropriate parameters. We choose to use
    # minute bars for this simulation -> freq="1m"
    # Returns a pandas dataframe.
    short_data = data.history(context.asset,
                              'price',
                              bar_count=short_window,
                              frequency="1T",
                              )
    short_mavg = short_data.mean()
    long_data = data.history(context.asset,
                             'price',
                             bar_count=long_window,
                             frequency="1T",
                             )
    long_mavg = long_data.mean()

    # Let's keep the price of our asset in a more handy variable
    price = data.current(context.asset, 'price')

    # If base_price is not set, we use the current value. This is the
    # price at the first bar which we reference to calculate price_change.
    if context.base_price is None:
        context.base_price = price
    price_change = (price - context.base_price) / context.base_price

    # Save values for later inspection
    record(price=price,
           cash=context.portfolio.cash,
           price_change=price_change,
           short_mavg=short_mavg,
           long_mavg=long_mavg)

    # Since we are using limit orders, some orders may not execute immediately
    # we wait until all orders are executed before considering more trades.
    orders = context.blotter.open_orders
    if len(orders) > 0:
        return

    # Exit if we cannot trade
    if not data.can_trade(context.asset):
        return

    # We check what's our position on our portfolio and trade accordingly
    pos_amount = context.portfolio.positions[context.asset].amount

    # Trading logic
    if short_mavg > long_mavg and pos_amount == 0:
        # we buy 100% of our portfolio for this asset
        order_target_percent(context.asset, 1)
    elif short_mavg < long_mavg and pos_amount > 0:
        # we sell all our positions for this asset
        order_target_percent(context.asset, 0)


def analyze(context, perf):
    # Get the quote_currency that was passed as a parameter to the simulation
    exchange = list(context.exchanges.values())[0]
    quote_currency = exchange.quote_currency.upper()

    # First chart: Plot portfolio value using quote_currency
    ax1 = plt.subplot(411)
    perf.loc[:, ['portfolio_value']].plot(ax=ax1)
    ax1.legend_.remove()
    ax1.set_ylabel('Portfolio Value\n({})'.format(quote_currency))
    start, end = ax1.get_ylim()
    ax1.yaxis.set_ticks(np.arange(start, end, (end - start) / 5))

    # Second chart: Plot asset price, moving averages and buys/sells
    ax2 = plt.subplot(412, sharex=ax1)
    perf.loc[:, ['price', 'short_mavg', 'long_mavg']].plot(
        ax=ax2,
        label='Price')
    ax2.legend_.remove()
    ax2.set_ylabel('{asset}\n({quote})'.format(
        asset=context.asset.symbol,
        quote=quote_currency
    ))
    start, end = ax2.get_ylim()
    ax2.yaxis.set_ticks(np.arange(start, end, (end - start) / 5))

    transaction_df = extract_transactions(perf)
    if not transaction_df.empty:
        buy_df = transaction_df[transaction_df['amount'] > 0]
        sell_df = transaction_df[transaction_df['amount'] < 0]
        ax2.scatter(
            buy_df.index.to_pydatetime(),
            perf.loc[buy_df.index, 'price'],
            marker='^',
            s=100,
            c='green',
            label=''
        )
        ax2.scatter(
            sell_df.index.to_pydatetime(),
            perf.loc[sell_df.index, 'price'],
            marker='v',
            s=100,
            c='red',
            label=''
        )

    # Third chart: Compare percentage change between our portfolio
    # and the price of the asset
    ax3 = plt.subplot(413, sharex=ax1)
    perf.loc[:, ['algorithm_period_return', 'price_change']].plot(ax=ax3)
    ax3.legend_.remove()
    ax3.set_ylabel('Percent Change')
    start, end = ax3.get_ylim()
    ax3.yaxis.set_ticks(np.arange(start, end, (end - start) / 5))

    # Fourth chart: Plot our cash
    ax4 = plt.subplot(414, sharex=ax1)
    perf.cash.plot(ax=ax4)
    ax4.set_ylabel('Cash\n({})'.format(quote_currency))
    start, end = ax4.get_ylim()
    ax4.yaxis.set_ticks(np.arange(0, end, end / 5))

    plt.show()


if __name__ == '__main__':

    run_algorithm(
            capital_base=1000,
            data_frequency='minute',
            initialize=initialize,
            handle_data=handle_data,
            analyze=analyze,
            exchange_name='bitfinex',
            algo_namespace=NAMESPACE,
            quote_currency='usd',
            start=pd.to_datetime('2018-02-07', utc=True),
            end=pd.to_datetime('2018-05-09', utc=True),
        )
回测结果
其他
如果还有什么不懂的,欢迎添加 微信 82789754 咨询
另外课程有详细的教CATALYST搭建和策略分享
–量化投资与数字货币实战
更多量化学习资源

扫上方二维码,关注公众账号 量化投资学院 ,获取下列免费资源
- 回复**“热点研报”**,获取近年热点券商金融工程研究报告
- 回复**“Python3”**,获取Python免费学习教程
- 更多福利请点击此链接
关注StudyQuant
-
课程
–量化投资与数据分析实战
–量化投资与数字货币实战
–免费Python及量化投资公开课 -
知乎
-
简书
-
公众号

