用echarts撸了个Nginx连接数监控
几个月前OA系统反应超慢,流程打开和提交都要等上10几秒,经过一段时间的数据库优化和session共享式web集群的应用,终于,不再每天被领导谈话了。
系统稳定后为了监控Nginx的连接数,就开启了Nginx的status模块,但是,每次访问都得自己刷新页面获取数据,刚开始为了应急就写了静态页面定时刷新,当时的效果是这样的:
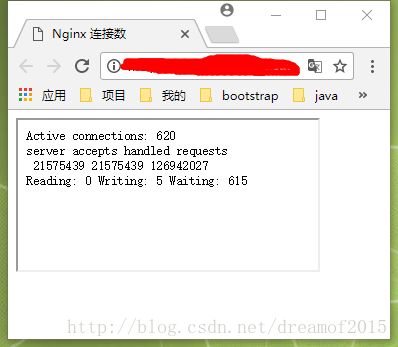
这里用JS写的定时刷新,每隔3秒刷新一次,代码如下:
<html lang="en">
<head>
    <meta charset="UTF-8">
    <title>Nginx 连接数title>
head>
<body>
<iframe src="http://ip/status">iframe>

<script>
    window.setInterval("refresh()",3000);
    function refresh() {
        self.location.reload();
    }
script>
body>
html>
后来看这个页面越看越不爽,看不爽怎么办,那就做个看得爽的。这就是后面做出来的效果:

每隔5秒定时获取status的数据,这里筛选掉数据只保留了Active connections,只显示当前2个小时内的数据,历史数据可做持久化操作(本来想做的,算了下要存储的数据量1天17280条,1个月接近52万,由于用的Oracle数据库还得建个范围分区表,还要定时维护,想想就麻烦…)。
下面贴一下代码:后台获取数据用的httpclient写的方法,前台展示用的echarts
前台页面的代码如下:
<html lang="en">
<head>
    <meta charset="UTF-8">
    <title>Nginx状态title>

    <script src="../js/echarts.min.js">script>
    <script src="../js/jquery.min.js">script>
head>
<body>
<div id="main" style="width: 100%;height:800px;">div>
<script>
    var myChart = echarts.init(document.getElementById('main'));
    //用ajax获取数据
    function getData() {
        var url = "http://ip/status";
        var htmlobj = $.ajax({url: "ajaxAction.jsp?action=nginxNums",data:{url:url},dataType:"json", async: false});
        var json = JSON.parse(htmlobj.responseText);
        var total = json.total;
        console.log(total);
        var date = json.date;
        var time = json.time;
        if(!total){
            total = 0;
        }
        timeData.push(time);
        lineData.push(total);
    }

    var timeData = [];//X轴的数据
    var lineData = [];//Y轴的数据

    option = {
        title: {
            text: 'Nginx连接数监控',
            x: 'left'
        },
        tooltip: {
            trigger: 'axis',

            axisPointer: {
                animation: false
            }
        },
        legend: {
            data: ['连接数'],
            x: 'left'
        },
        toolbox: {
            feature: {
                dataZoom: {
                    yAxisIndex: 'none'
                },
                restore: {},
                saveAsImage: {}
            }
        },
        axisPointer: {
            link: {
                xAxisIndex: 'all'
            }
        },
        dataZoom: [{
            show: true,
            realtime: true,
            start: 0,
            end: 100,
            xAxisIndex: [0, 1]
        }, {
            type: 'inside',
            realtime: true,
            start: 0,
            end: 100,
            xAxisIndex: [0, 1]
        }],
        grid: [{
            left: 40,
            right: 40
        }, {
            left: 40,
            right: 40
        }],
        xAxis: [{
            type: 'category',
            boundaryGap: false,
            axisLine: {
                onZero: true
            },
            data: timeData
        }, {
            gridIndex: 1
        }],

        yAxis: [{
            type: 'value',
            max: 2000,
            name: '单位:个',
            min: 0,
            interval: 100
        }, {
            gridIndex: 1
        }],
        series: [{
            name: '数值',
            type: 'line',
            smooth: true,
            symbol: 'circle',
            symbolSize: 9,
            showSymbol: false,
            lineStyle: {
                normal: {
                    width: 1
                }
            },
            markPoint: {
                data: [{
                    type: 'max',
                    name: '最大值'
                }, {
                    type: 'min',
                    name: '最小值'
                }]
            },
            markArea: {
                silent: true,
                label: {
                    normal: {
                        position: ['10%', '50%']
                    }
                },
                data: [
                    [{
                        name: '低',
                        yAxis: 500,
                        itemStyle: {
                            normal: {
                                color: 'rgba(250,250,51,0.2)'
                            }
                        }
                    }, {
                        yAxis: 1000
                    }],
                    [{
                        name: '中',
                        yAxis: 1000,
                        itemStyle: {
                            normal: {
                                color: 'rgba(153,204,51,0.2)'
                            }
                        }
                    }, {
                        yAxis: 1500
                    }],
                    [{
                        name: '高',
                        yAxis: 1500,
                        itemStyle: {
                            normal: {
                                color: 'rgba(0,153,153,0.27)'
                            }
                        }
                    }, {
                        yAxis: 2000
                    }]
                ]
            },
            data: lineData
        }]
    };

    myChart.setOption(option);
    setInterval(function () {
        //只保留一小时类的数据:60*60/5=720
        if(timeData.length>720){
            timeData.shift();
            lineData.shift();
        }
        //动态获取数据
        getData();
        //重设图标数据
        myChart.setOption({
            xAxis:[{
                data:timeData
            }],
            series: [{
                data: lineData
            }]
        });
    }, 5000);
script>
body>
html>
ajaxAction.jsp代码如下:
<%@ page import="com.eweaver.base.util.StringHelper" %>
<%@ page import="com.eweaver.app.interfaces.HttpRequestUtils" %>
<%@ page import="net.sf.json.JSONObject" %>
<%@ page contentType="text/html; charset=UTF-8"%>
<%
    String action = StringHelper.null2String(request.getParameter("action"));
    String url = StringHelper.null2String(request.getParameter("url"));
    if("nginxNums".equals(action)){
        JSONObject jsonObject = HttpRequestUtils.httpGetNginxRequestNums(url);
        response.getWriter().print(jsonObject.toString());
    }
%>
HttpRequestUtils的httpGetNginxRequestNums(String url)方法如下:
/**
     * 获取Nginx的连接数
     * @param url
     * @return
     */
    public static JSONObject httpGetNginxRequestNums(String url){
        CloseableHttpClient httpclient = HttpClients.createDefault();
        JSONObject jsonObject = new JSONObject();
        SimpleDateFormat simpleDateFormat = new SimpleDateFormat("yyyy-MM-dd HH:mm:ss");
        String total = "0";
        HttpGet httpGet = new HttpGet(url);
        try {
            CloseableHttpResponse response = httpclient.execute(httpGet);
            BufferedReader in = new BufferedReader(new InputStreamReader(response.getEntity().getContent()));
            StringBuffer sb = new StringBuffer("");
            String line = "";
            String NL = System.getProperty("line.separator");
            while ((line = in.readLine()) != null) {
                sb.append(line + NL);
            }
            in.close();
            String content = sb.toString();
            if(content.length()>1){
                String[] contentArr = content.split("\r\n");
                total = contentArr[0].split(": ")[1];
                total = total.split(" ")[0];
                total = total.trim();
            }
        } catch (IOException e) {
            e.printStackTrace();
        }
        String nowDate = simpleDateFormat.format(new Date());
        jsonObject.put("date",nowDate.split(" ")[0]);
        jsonObject.put("time",nowDate.split(" ")[1]);
        jsonObject.put("total",total);
        return jsonObject;
    }
这个代码还是很简单的。唯一的难点是卡在echarts折线图如何动态的获取数据,看了官网上的例子动态数据+时间坐标轴想把X轴的数据换成秒来显示总是失败,后来看其他例子发现多个背景颜色图,虽然这个数据也是静态的,但是却带给了我思路,xAxis.type属性用category也可以用动态数据来展示,之前一直以为category就是固定的。解决了这个问题就先写了个静态页面去组装数据,测试完全没问题,然后再修改成动态获取,搞定。
下面是静态页面的代码:
<html lang="en">
<head>
  <meta charset="UTF-8">
  <title>动态折线图title>
  <script src="../js/echarts.js">script>
head>
<body>
<div id="main" style="width: 100%;height:600px;">div>
<script>
  var myChart = echarts.init(document.getElementById('main'));

  function getData() {
    var nowDate = new Date();
    var hour = nowDate.getHours();
    var minute = nowDate.getMinutes();
    var seconds = nowDate.getSeconds();
    var time = hour+":"+minute+":"+seconds;
    timeData.push(time);
    lineData.push(Math.round(Math.random()*100)*10);
  }

  var timeData = [];
  var lineData = [];

  option = {
    title: {
      text: '动态折线图',
      x: 'left'
    },
    tooltip: {
      trigger: 'axis',

      axisPointer: {
        animation: false
      }
    },
    legend: {
      data: ['连接数'],
      x: 'left'
    },
    toolbox: {
      feature: {
        dataZoom: {
          yAxisIndex: 'none'
        },
        restore: {},
        saveAsImage: {}
      }
    },
    axisPointer: {
      link: {
        xAxisIndex: 'all'
      }
    },
    dataZoom: [{
      show: true,
      realtime: true,
      start: 0,
      end: 100,
      xAxisIndex: [0, 1]
    }, {
      type: 'inside',
      realtime: true,
      start: 0,
      end: 100,
      xAxisIndex: [0, 1]
    }],
    grid: [{
      left: 40,
      right: 40
    }, {
      left: 40,
      right: 40
    }],
    xAxis: [{
      type: 'category',
      boundaryGap: false,
      axisLine: {
        onZero: true
      },
      data: timeData
    }, {
      gridIndex: 1
    }],

    yAxis: [{
      type: 'value',
      max: 1000,
      name: '单位:个',
      min: 0,
      interval: 50
    }, {
      gridIndex: 1
    }],
    series: [{
      name: '数值',
      type: 'line',
      smooth: true,
      symbol: 'circle',
      symbolSize: 9,
      showSymbol: false,
      lineStyle: {
        normal: {
          width: 1
        }
      },
      markPoint: {
        data: [{
          type: 'max',
          name: '最大值'
        }, {
          type: 'min',
          name: '最小值'
        }]
      },
      markArea: {
        silent: true,
        label: {
          normal: {
            position: ['10%', '50%']
          }
        },
        data: [
          [{
            name: '低',
            yAxis: 0,
            itemStyle: {
              normal: {
                color: 'rgba(0,153,153,0.27)'
              }
            }
          }, {
            yAxis: 300
          }],
          [{
            name: '中',
            yAxis: 300,
            itemStyle: {
              normal: {
                color: 'rgba(153,204,51,0.2)'
              }
            }
          }, {
            yAxis: 600
          }],
          [{
            name: '高',
            yAxis: 600,
            itemStyle: {
              normal: {
                color: 'rgba(250,250,51,0.2)'
              }
            }
          }, {
            yAxis: 1000
          }]
        ]
      },
      data: lineData
    }]
  };

  myChart.setOption(option);
  setInterval(function () {

    // for (var i = 0; i < 5; i++) {
    //   data.shift();
    //   data.push(getData());
    // }
    getData();
    myChart.setOption({
      xAxis:[{
          data:timeData
      }],
      series: [{
        data: lineData
      }]
    });
  }, 5000);
script>
body>
html>
git地址:https://github.com/dreamof2080/echartsLine.git