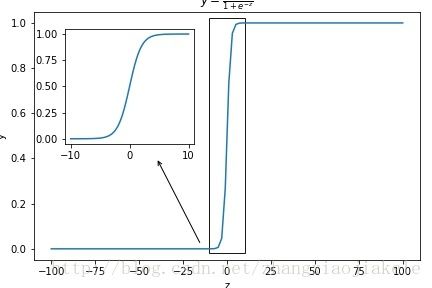
使用Matplotlib实现局部区域放大的两种方法
- 通过添加axes实现局部区域的放大效果
from matplotlib import pyplot as plt
import matplotlib.patches as Patches
import numpy as np
plt.close("all")
fig=plt.figure(dpi=300)
ax=fig.add_subplot(111)
ax.plot(x,y)
sub_axe=plt.axes([0.15,0.5,0.3,0.4])
x1=np.linspace(-10,10,100)
y1=np.array([1],dtype=np.float32)/(1+np.exp(-x1))
sub_axe.plot(x1,y1)
plt.tight_layout()
sq=Patches.Rectangle((-10,-0.02),width=20,height=1.04,color="black",alpha=0.9,
                    transform=ax.transData,fill=False)
ax.add_patch(sq)
ax.annotate("",(-40,0.4),(-15,0.02),arrowprops=dict(arrowstyle="->",
                                                         connectionstyle="arc"))
ax.set_xlabel("z")
ax.set_ylabel("y")
ax.set_title(r"$y=\frac{1}{1+e^{-z}}$")

