matplotlib.pyplot绘图【知识整理】
matplotlib.pyplot库的使用(基础)
- 综述
- 代码模块
- 绘制条形图
- 子图
- 条形图
- 散点图
- 柱状图
- 盒图
- 细节设置
- 小结
综述
学生党整理一些关于数据分析的知识:主要整理了一些matplotlib.pyplot库的绘制图像的函数(基础)。包括了绘制折线图、子图操作、柱状图、条形图、盒图及一些细节处理。
代码模块
import pandas as pd
import numpy as np
import matplotlib.pyplot as plt
绘制条形图
单条折线图
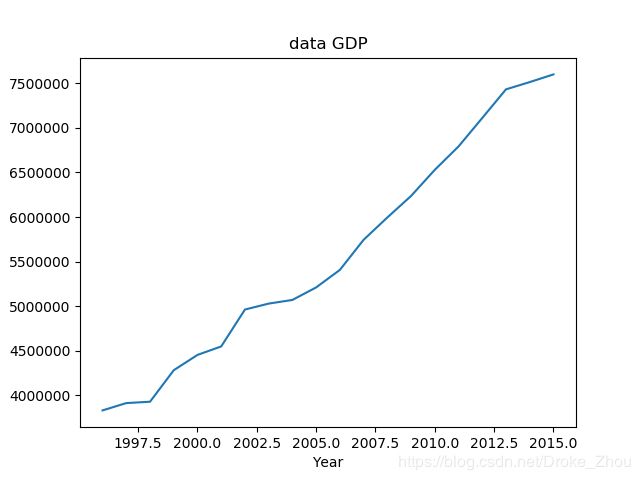
plt.plot(data_figure1['year'],data_figure1['x1'])  #画图
plt.xticks(rotation = 0)   #x轴旋转角度
plt.xlabel('Year')  #x轴标签
plt.ylabel('x1')    #y轴标签
plt.title('data GDP')   #标题
plt.show()  #显示
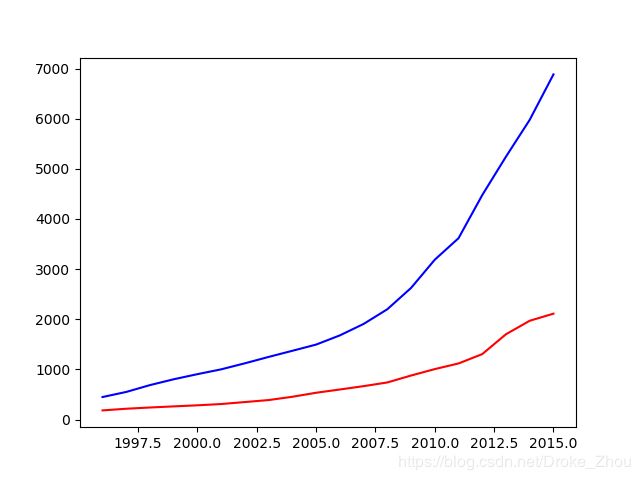
data_figure2 = data[['year','x2','x3']]
fig = plt.figure()
plt.plot(data_figure2['year'],data_figure2['x2'],c = 'red')
plt.plot(data_figure2['year'],data_figure2['x3'],c = 'blue')
plt.show()
data_figure3 = data[['year','x2','x3','x7','y','x11']]
colors = ['red','blue','green','orange','black']
plt.plot(data_figure3['year'],data_figure3['x2'],c = colors[0],label = 'x2')
plt.plot(data_figure3['year'],data_figure3['x3'],c = colors[1],label = 'x3')
plt.plot(data_figure3['year'],data_figure3['x7'],c = colors[2],label = 'x7')
plt.plot(data_figure3['year'],data_figure3['y'],c = colors[3],label = 'y')
plt.plot(data_figure3['year'],data_figure3['x11'],c = colors[4],label = 'x11')
plt.legend(loc = 'best')    #添加图例 loc = 图例位置 best可以放置在最好的位置
plt.show()
子图
#子图操作
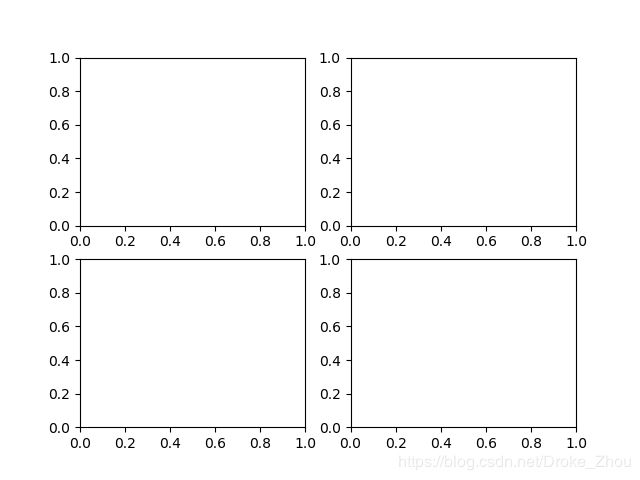
fig = plt.figure()
ax1 = fig.add_subplot(2,2,1)
ax2 = fig.add_subplot(2,2,2)
ax3 = fig.add_subplot(2,2,3)
ax4 = fig.add_subplot(2,2,4)
plt.show()

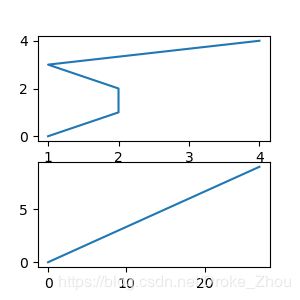
fig = plt.figure(figsize=(3,3)) #(长,宽)
ax1 = fig.add_subplot(2,1,1)
ax2 = fig.add_subplot(2,1,2)
ax1.plot(np.random.randint(1,5,5),np.arange(5))
ax2.plot(np.arange(10)*3,np.arange(10))
plt.show()
条形图
条形图分为横向条形图和纵向条形图
#竖向
from numpy import arange
bar_heights = data_figure1
bar_positions = arange(len(bar_heights['x1']))+1
fig, ax = plt.subplots()
ax.bar(bar_positions,bar_heights['x1'].values,0.5)    #0.5表示宽度
#x轴显示对应年份
ax.set_xticks(range(1,21))
ax.set_xticklabels(bar_heights['year'].values)
plt.show()

#横向
bar_heights = data_figure1
bar_positions = arange(len(bar_heights['x1']))+1
fig, ax = plt.subplots()
ax.barh(bar_positions,bar_heights['x1'].values,0.5)    #0.5表示宽度 横向
#x轴显示对应年份
ax.set_yticks(range(1,21))
ax.set_yticklabels(bar_heights['year'].values)
plt.show()

#横向和纵向的区别为 bar为纵向 barh为横向
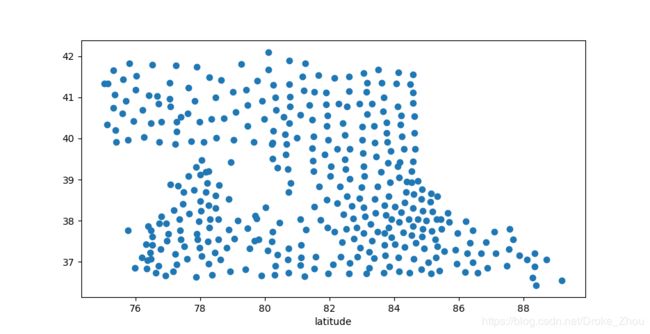
散点图
all_county = pd.read_csv('all_county.csv')
fig, ax = plt.subplots()
ax.scatter(all_county['longitude'],all_county['latitude'])
ax.set_xlabel('longitude')
ax.set_xlabel('latitude')
plt.show()

#子图
fig = plt.figure()
ax1 = fig.add_subplot(1,2,1)
ax2 = fig.add_subplot(1,2,2)
ax1.scatter(all_county['longitude'],all_county['latitude'])
ax1.set_xlabel('longitude')
ax1.set_xlabel('latitude')
ax2.scatter(all_county['longitude'],all_county['latitude'])
ax2.set_xlabel('longitude')
ax2.set_xlabel('latitude')
plt.show()
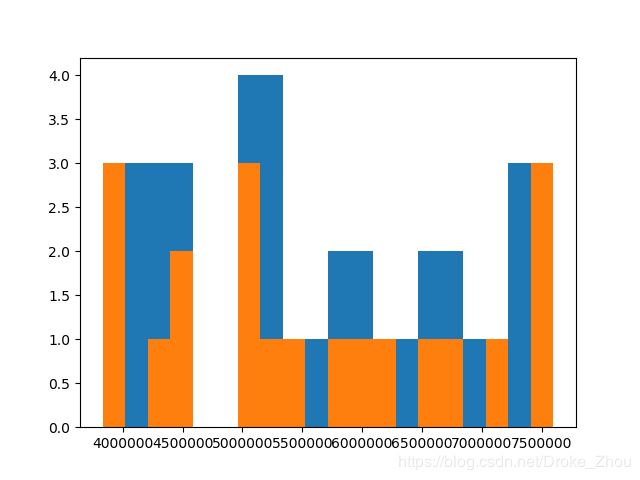
柱状图
bins = 柱的个数,不添加bins参数时系统默认设置合适的数量
fig, ax = plt.subplots()
ax.hist(data_figure1['x1'])
ax.hist(data_figure1['x1'],bins = 20)
plt.show()
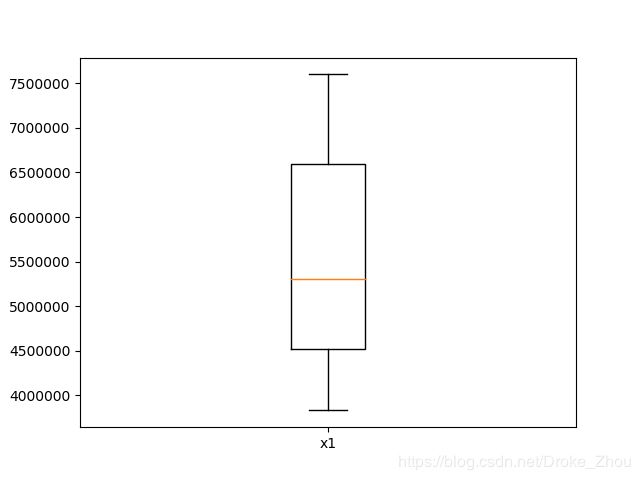
盒图
#盒图
fig, ax = plt.subplots()
ax.boxplot(data_figure1['x1'])
ax.set_xticklabels(['x1'])
plt.show()

fig, ax = plt.subplots()
x = ['x1','x2','x3','x4']
ax.boxplot(data[x])
ax.set_xticklabels(x)
plt.show()
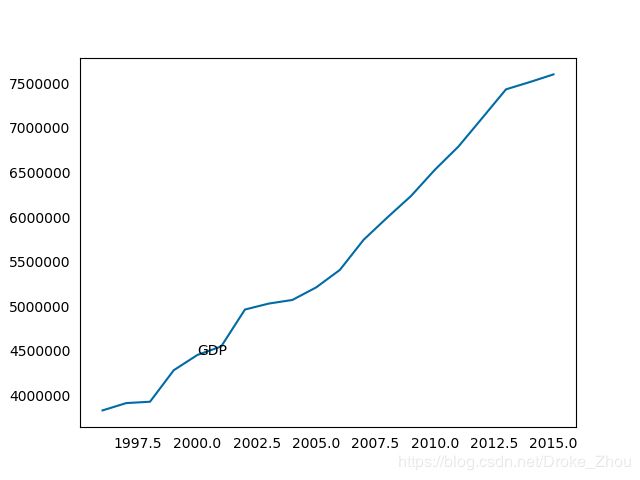
细节设置
#rgb设置颜色属性
color_1 = (0/255,107/255,164/255)

#可视化图片可以去掉边框线,刻度等
#在图上做标记
fig, ax = plt.subplots()
ax.plot(data_figure1['year'],data_figure1['x1'],c = color_1)  #画图
ax.xlabel('Year')  #x轴标签
ax.ylabel('x1')    #y轴标签
ax.title('data GDP')   #标题
ax.tick_params(bottom = False,top = False,left = False,right = False)  #去除标线
ax.text(2000,4453911,'GDP')	#在指定位置标记GDP
plt.show()  #显示
小结
matplotlib.pyplot绘图较为简单,之后会增加seaborn库绘图。
