吴恩达老师机器学习第二次作业——逻辑回归(python实现)
github地址:https://github.com/Europe233/ml_homework_py/tree/master/exercise2
【第一部分:不带正则化】
这一部分的数据是这样的:
我们用一个线性函数来分割两种不同种类的点。做完逻辑回归后结果是这样的:

代码如下:
ex2.py
import numpy as np
import scipy.optimize as opt

from plotData import *
from costFunction import *
from plotDecisionBoundary import *

# ================第一部分:载入数据和画图===============
data = np.loadtxt('ex2data1.txt',delimiter=',',usecols=(0,1,2))
x = data[:,0:2]
y = data[:,2]
plot_dataset1(x,y)
plt.show()

# ================第二部分:优化=========================
#数据数量m
m = y.size

#加上一列1到x
X = np.c_[np.ones(m),x]

#初始参数
n = X.shape[1]
ini_theta = np.zeros(n)
print("ini_cost:   ",cost(ini_theta,X,y))
print("ini_grad:   ",gradient(ini_theta,X,y),"\n\n")

#使用scipy中的bfgs优化方法
opt_theta,opt_cost,*unused = opt.fmin_bfgs(f=cost,x0=ini_theta,fprime=gradient,args=(X,y),full_output=True)

# ================第三部分:画出decision boundry=============
plot_dataset1(x,y)
plot_decision_boundary(opt_theta)
plt.show()
plotData.py
"""用于数据可视化"""
import numpy as np
import matplotlib.pyplot as plt

def plot_data_points(x,y):
    """画出数据点分布,不同类型用不同颜色"""
    #得到数据的组数
    m = y.size

    type1_x=[]
    type1_y=[]
    type2_x=[]
    type2_y=[]
    for i in range(m):
        if y[i] == 0:
            type1_x.append(x[i,0])
            type1_y.append(x[i,1])
        else:
            type2_x.append(x[i,0])
            type2_y.append(x[i,1])

    #画图
    plt.scatter(type1_x,type1_y,c='yellow',marker='o',edgecolors='black',s=15)
    plt.scatter(type2_x,type2_y,c='black',marker='+',edgecolors='black',s=15)

def plot_dataset1(x,y):
    plot_data_points(x,y)
    #坐标轴范围和legend
    plt.axis([10,120,10,120])
    plt.legend(['Not Admitted','Adimitted'],loc=1)

def plot_dataset2(x,y):
    plot_data_points(x,y)
    #坐标轴范围和legend
    plt.axis([-1,1.2,-1,1.2])
    plt.legend(['y=0','y=1'],loc=1)
sigmoid.py
import numpy as np

def sigmoid_single_value(z):
    return 1.0/(1+np.exp(-z))

def sigmoid_matrix(x):
    """x的类型是np.array"""
    size_tuple = x.shape
    res = np.asarray(x,dtype=float)


    if len(size_tuple) == 1:
        # x 是 vector 时:
        for i in range(size_tuple[0]):
            res[i] = sigmoid_single_value(x[i])

    elif len(size_tuple) == 2:
        # x 是 matrix 时:
        for i in range(size_tuple[0]):
            for j in range(size_tuple[1]):
                res[i][j] = sigmoid_single_value(x[i][j])

    return res
costFunction.py
"""返回cost和gradient"""

import numpy as np

from sigmoid import *

def cost(theta,X,y):
    """返回cost"""
    #样本数m
    m = y.size

    #当前参数下,对于每个样本的预测结果(是种类1的概率)
    h_theta = sigmoid_matrix(np.dot(theta,X.T))

    total_cost = 0.
    for i in range(m):
        if y[i] == 1:
            total_cost -= np.log(h_theta[i])
        elif y[i] == 0:
            total_cost -= np.log(1-h_theta[i])
    total_cost = total_cost/m

    return total_cost


def gradient(theta,X,y):
    """返回gradient"""
    #样本数m
    m = y.size

    #当前参数下,对于每个样本的预测结果(是种类1的概率)
    h_theta = sigmoid_matrix(np.dot(theta,X.T))

    cnt_gradient = np.zeros(theta.shape)
    for i in range(m):
        cnt_gradient += (h_theta[i]-y[i])*X[i,:]
    cnt_gradient = cnt_gradient/m

    return cnt_gradient
plotDecisionBoundary.py
import numpy as np
import matplotlib.pyplot as plt

from plotData import *

def plot_decision_boundary(theta):
    """为 ex2.py 画出 decision boundary"""
    boud_x = np.array([10,120])
    boud_y = (-theta[1]*boud_x-theta[0])/theta[2]
    plt.plot(boud_x,boud_y,'b-')
【第二部分:带正则化】
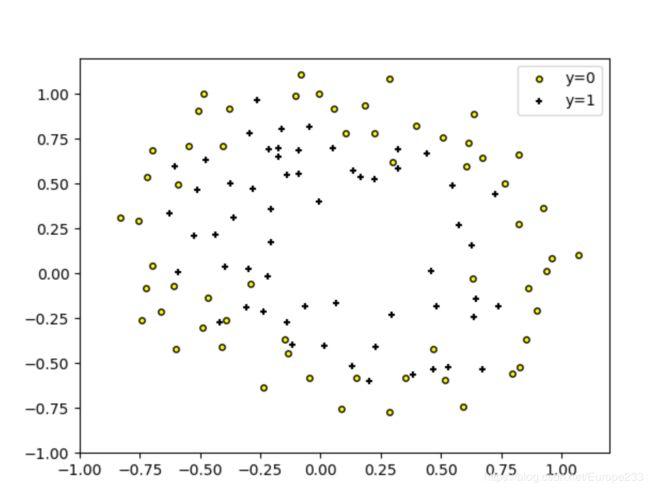
这一部分的数据是这样的:

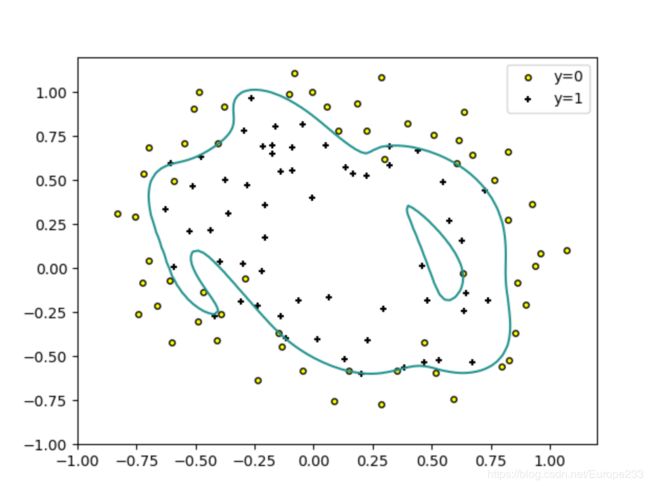
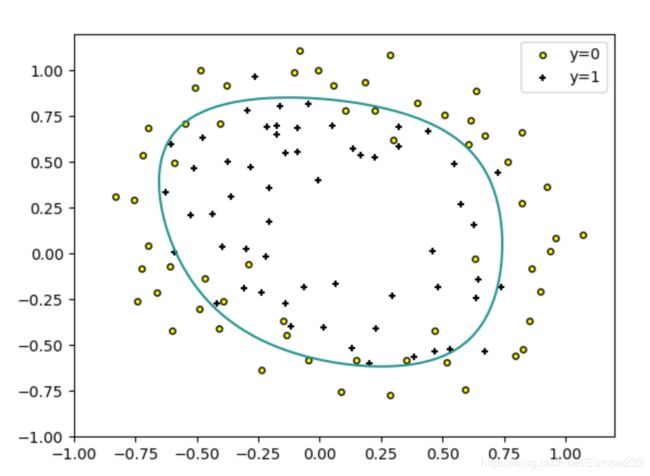
这里我们不能用线性的直线来分开两种类型,一种可行方法就是用高次项的feature,以产生非线性的decision boundary。此时要考虑过拟合的问题。因此我们加上正则项。结果如下:
( λ = 1 \lambda=1 λ=1)拟合较好时:
( λ = 0 \lambda=0 λ=0)过拟合时:
( λ = 100 \lambda=100 λ=100)欠拟合时:
代码如下:
ex2_reg.py
import numpy as np
import scipy.optimize as opt

from mapFeature import *
from plotData import *
from costFunctionReg import *
from plotDecisionBoundary import *

# ============第一部分:加载数据并画图 =======================
data = np.loadtxt('ex2data2.txt',delimiter=',')
x = data[:,0:2]
y = data[:,2]

plot_dataset2(x,y)
plt.show()
# ============第二部分:优化 ===================
#产生新的feature
X = map_feature(x[:,0],x[:,1])

#初始参数和lambda的值
ini_theta = np.zeros(28)
lambda_val = 100

opt_theta,opt_cost,*unused = opt.fmin_bfgs(f=cost_reg,x0=ini_theta,fprime=gradient_reg,args=(X,y,lambda_val),full_output=1)
# ============第三部分:画出decision boundary==========
plot_dataset2(x,y)
plot_decision_boundary_reg(opt_theta)
plt.show()

plot_dataset2(x,y)
plot_decision_boundary_reg_unused(opt_theta)
plt.show()
mapFeature.py
"""接受x,返回新的feature(排成一个矩阵X,每一行对应一个样本)"""

import numpy as np

def map_feature(x1,x2):
    #样本数m
    m = x1.shape[0]

    result = np.ones(m)
    for degree in range(6):
        degree += 1
        for i in range(degree+1):
            result = np.c_[result,(x1**(degree-i))*(x2**i)]

    return result
costFuctionReg.py
import numpy as np

from sigmoid import *

def cost_reg(theta,X,y,lambda_val):
    """返回cost"""
    #样本数m
    m = y.size

    #当前参数下,对于每个样本的预测结果(是种类1的概率)
    h_theta = sigmoid_matrix(np.dot(theta,X.T))

    total_cost = 0.
    for i in range(m):
        if y[i] == 1:
            total_cost -= np.log(h_theta[i])
        elif y[i] == 0:
            total_cost -= np.log(1-h_theta[i])
    total_cost = total_cost/m

    total_cost += lambda_val*np.dot(theta[1:],theta[1:])/(2*m)

    return total_cost

def gradient_reg(theta,X,y,lambda_val):
    """返回gradient"""
    #样本数m
    m = y.size

    #当前参数下,对于每个样本的预测结果(是种类1的概率)
    h_theta = sigmoid_matrix(np.dot(theta,X.T))

    cnt_gradient = np.zeros(theta.shape)
    for i in range(m):
        cnt_gradient += (h_theta[i]-y[i])*X[i,:]

    cnt_gradient += np.r_[0,lambda_val*theta[1:]]
    cnt_gradient = cnt_gradient/m

    return cnt_gradient
plotDecisionBoundary.py
import numpy as np
import matplotlib.pyplot as plt

from plotData import *
from mapFeature import *

def plot_decision_boundary_reg(theta):
    """画出非线性的decision boundary"""
    #划分网格
    grid_x = np.linspace(-1,1.2,100)
    grid_y = np.linspace(-1,1.2,100)
    xx,yy = np.meshgrid(grid_x,grid_y)

    #计算z:各个节点处,z>=0 代表判断为类型1
    z = np.dot(map_feature(xx.ravel(),yy.ravel()),theta)
    z = z.reshape(xx.shape)

    plt.contour(xx,yy,z,0)
【个人收获和总结】``
- 过程里查了一些资料,对numpy中的ndarray复制有了更多的一点了解,参考:https://blog.csdn.net/u010099080/article/details/59111207 .
- 使用了一些现成的优化工具,主要在 scipy.optimize 中,参考:
https://docs.scipy.org/doc/scipy/reference/optimize.html - 过程里发现要注意numpy中ndarray的数据类型。例如如果对一个整型的ndarray的每一项赋值,都会自动把值转换成整型。可以使用:
new_x = np.asarray(x,dtype=float)来转换数据类型。 - 在这个过程里,画非线性的decision boundary时,我一开始的想法是,划分网格,对每个网格点判断这个点的“左边0.5格的那个点”和“右边0.5格那个点”是否是同一类型的,如果不是同一类型的,认为这个网格点在boundary上;否则,再判断判断这个点的“上边0.5格的那个点”和“下面0.5格那个点”是否是同一类型的,如果不是同一类型的,认为这个网格点在boundary上,否则不在之上。最后把这些点一个个画出来:
def which_class(theta,x1,x2):
    """基于模型得到的参数,判断一个点(x1,x2)是哪一类的"""
    x1 = np.array([x1])
    x2 = np.array([x2])
    z = np.dot(theta,map_feature(x1,x2).ravel())
    if z < 0:
        return 0
    return 1


def is_on_decision_boundary(theta,x1,x2,delta):
    """判断一个点(x1,x2)是否在非线性的decision boundary上"""
    #如果一个点,它左边delta/2和右边delta/2那两个点不是同一类的,认为这个点在decision boundary上
    #同理,如果上面delta/2和下面delta/2那两个点不是同一类的,也认为它在之上
    if which_class(theta,x1-delta/2,x2) != which_class(theta,x1+delta/2,x2):
        return 1
    elif which_class(theta,x1,x2-delta/2) != which_class(theta,x1,x2+delta/2):
        return 1
    return 0

def plot_decision_boundary_reg_unused(theta):
    """为 ex2_reg.py 画出 decision boundary"""
    #设定一个范围,在这个矩形范围里画图
    min_x = -1.0
    max_x = 1.2
    min_y = -1.0
    max_y = 1.2

    #划分网格,然后对网格里每一个节点进行判断它是否在decision boundary上
    delta = 0.05 #一个网格的长和宽
    num_x = int((max_x-min_x)/delta+1)
    num_y = int((max_y-min_y)/delta+1)

    grid_x = np.linspace(min_x,max_x,num=num_x)
    grid_y = np.linspace(min_y,max_y,num=num_y)

    boundary_points_x = []
    boundary_points_y = []
    for i in range(num_x):
        for j in range(num_y):
            if is_on_decision_boundary(theta,grid_x[i],grid_y[j],delta):
                boundary_points_x.append(grid_x[i])
                boundary_points_y.append(grid_y[j])

    #画图
    plt.scatter(boundary_points_x,boundary_points_y,c='blue',marker='o',s=5)
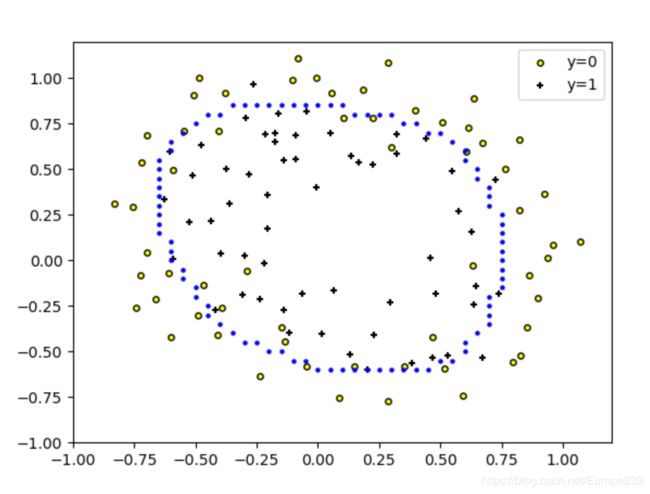
效果如下:


这段代码是不够好的:首先,对每个网格点,都要计算周边4个点的类型,计算量更大(而且这时不是用矩阵的方式计算的,而是一个点一个点地计算),耗时明显更长。其次,最后的效果也不够好。
后面的图是使用了contour函数,在前人的肩上走路,更好也更快。