胸罩数据分析以及可视化
胸罩数据分析以及可视化
上次用爬虫爬取了天猫还有京东的胸罩数据,不能让数据躺在硬盘里边睡大觉,不用来分析的数据和垃圾没有区别。所以今天就对采集到的数据进行分析,主要是胸罩种类分析,以及罩杯种类分析。
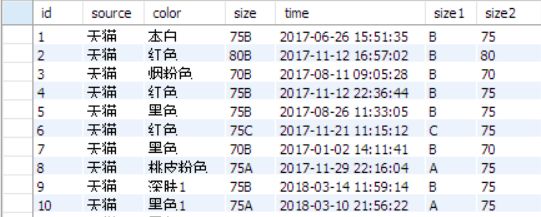
数据库中数据结构如下图:
分析数据以主要使用pandas,可视化使用matplotlib。基本用法就不提了,百度一大把。这里推荐《利用python》进行数据分析一书,某东某当都有卖的。下边主要提几个主要的函数以及用法。
- Series.to_frame(): 将pandas的series对象转化为dataframe对象,参数name可以指定column的名称
- pandas.index.tolist(): 可以将索引转化为列表,方便操作索引,对多重索引也试用。
- pandas.concat(DataFrame1,DataFrame2): 可以连接两个DataFraem.
代码如下,内容有注释:
# -*- coding: utf-8 -*-
# @Author: Nessaj
# @Date:   2018-05-22 18:07:40
# @Last Modified by:   Nessaj
# @Last Modified time: 2018-05-22 20:24:04
# -*- coding: utf-8 -*-
# @Author: Nessaj
# @Date:   2018-03-18 22:47:47
# @Last Modified by:   Nessaj
# @Last Modified time: 2018-03-31 14:29:39
from matplotlib import pyplot as plt
from pandas import DataFrame
import pandas as pd
import sqlalchemy
import numpy as np


engine=sqlalchemy.create_engine("mysql+pymysql://root:123456@localhost:3306/bra")
plt.rcParams['font.sans-serif']=['SimHei']
sales = pd.read_sql('select size1,size2 from t_sales',engine)


def bra1():
    size1size2=sales.groupby(['size1','size2'])['size1'].count()
    #转化为一个DataFrame,且column命名为count
    size1size2=size1size2.to_frame(name='count')
    #构建一个DataFrame,选取数量不足200的胸罩类型,同时索引与size1size2保持一致
    others = DataFrame([size1size2[size1size2['count'] <=
         200].sum()],index=pd.MultiIndex(levels=[[''],['other']],labels=[[0],[0]]))
    #concat用于连接两个DataFrame,默认纵向连接。
    #下边一个函数使用append可以达到一样的效果
    final=pd.concat([size1size2[(size1size2['count']>200)],others])
    #选取数量最多的10个胸罩种类
    most10=final.sort_values(['count'])[-10:]
    #索引转化为数组,方便操作。
    labels=most10.index.tolist()
    mylabels=[]
    for label in labels:
        mylabels.append(label[1]+label[0])
    explode=[0,0,0,0,0,0,0,0,0,0.1]
    plt.figure(figsize=(10,13))
    ax1=plt.subplot()
    #画图函数,可以接收三个返回值,图,图外标签文字,图内百分比pct文字。这样之后就可以设置文字大小了
    #pie图参数,explode突出某个饼块,labeldistance设置标签离圆心距离(单位是几倍半径)
    patches,l_text,p_text=ax1.pie(most10,labels=mylabels,autopct='%.1f%%',shadow=True,explode=explode,startangle=270,labeldistance=1.1)
    #设置文字大小
    for t in l_text:
        t.set_size(20)
    for t in p_text:
        t.set_size(20)
    ax1.set_title('胸围罩杯分布',fontsize=20)
    plt.axis('equal')
    plt.tight_layout()
    #通过legend的返回值可以设置图例的颜色字体大小等
    legend = plt.legend( loc=(0.8,0.5),title='legend', shadow=True,fontsize=20)
    # legend.get_frame().set_facecolor('#00FFCC')
    legend.get_title().set_fontsize(fontsize = 20)
    plt.show()

def bra2():
    type=sales.groupby('size1')['size2'].count()
    type=type.to_frame(name='count')
    other=DataFrame([type[type['count']<500].sum()],index=['other'])
    #用append连接DataFrame,使用上边的concat也行
    finaltype=type[type['count']>=500].append(other)
    #调整饼图各个块的位置,本例最小的两块都很小,如果相邻会导致拼图上文字重叠
    ran=finaltype.ix[['A','B','C','other','D','E']]
    plt.figure(figsize=(10,10))
    ax2=plt.subplot()
    explode=[0,0.1,0,0,0,0]
    f,l_text,p_text=ax2.pie(ran,shadow=True,startangle=90,autopct='%.1f%%',labels=ran.index,labeldistance=1.04,explode=explode)
    for t in p_text:
        t.set_size(20)
    for t in l_text:
        t.set_size(20)
    plt.axis('equal')
    ax2.set_title('罩杯分布',fontsize=20)
    plt.show()
bra1()
# bra2()
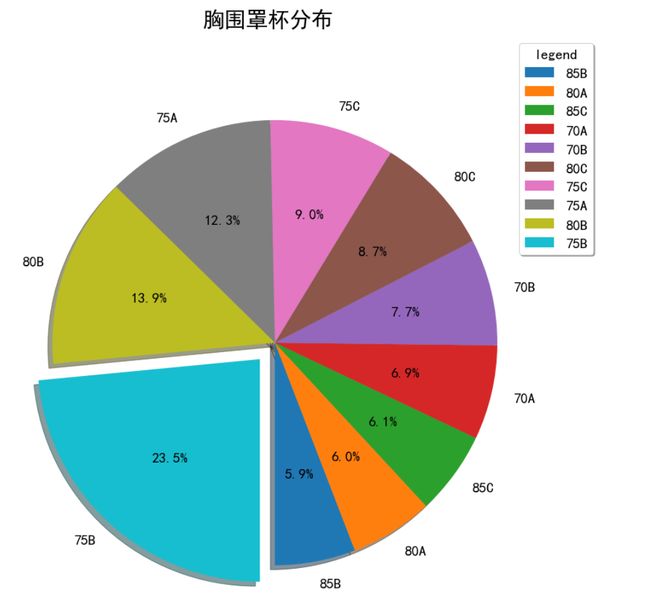
胸围罩杯分布结果如下图:
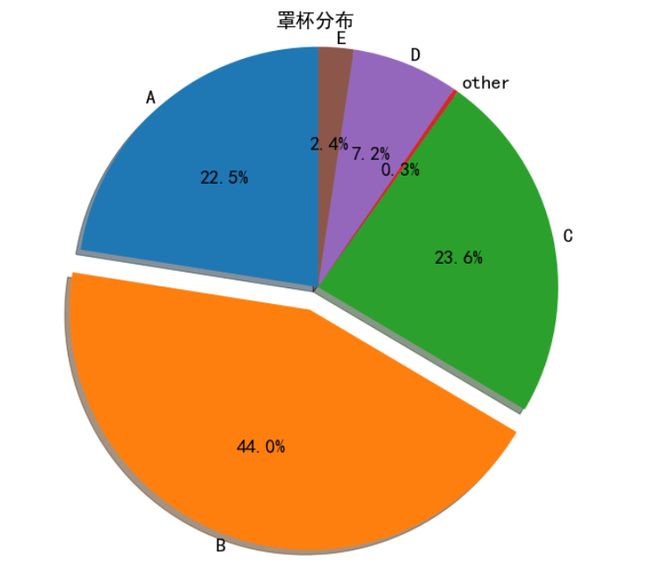
罩杯分布如下图:
分析
由图知,中国女人胸罩75B最多,其次是80B和75A,这三个加起来一共占了一半。
罩杯中,A,B罩杯加起来几乎有70%,这这这,哎,听说俄罗斯妹子评价都是C。
结语
本文介绍了pandas的基本使用,matplotlib画饼图的方法,以及一些参数设置。得出了中国女人的罩杯分布特性。
源码已上传github,喜欢的点个赞啦~


